File name: Southwest_CEI_maxtemps_1910-2020_1200.jpg
Original Resolution: 1200 × 630
File Size: 97 KB (MIME Type: image/jpeg)
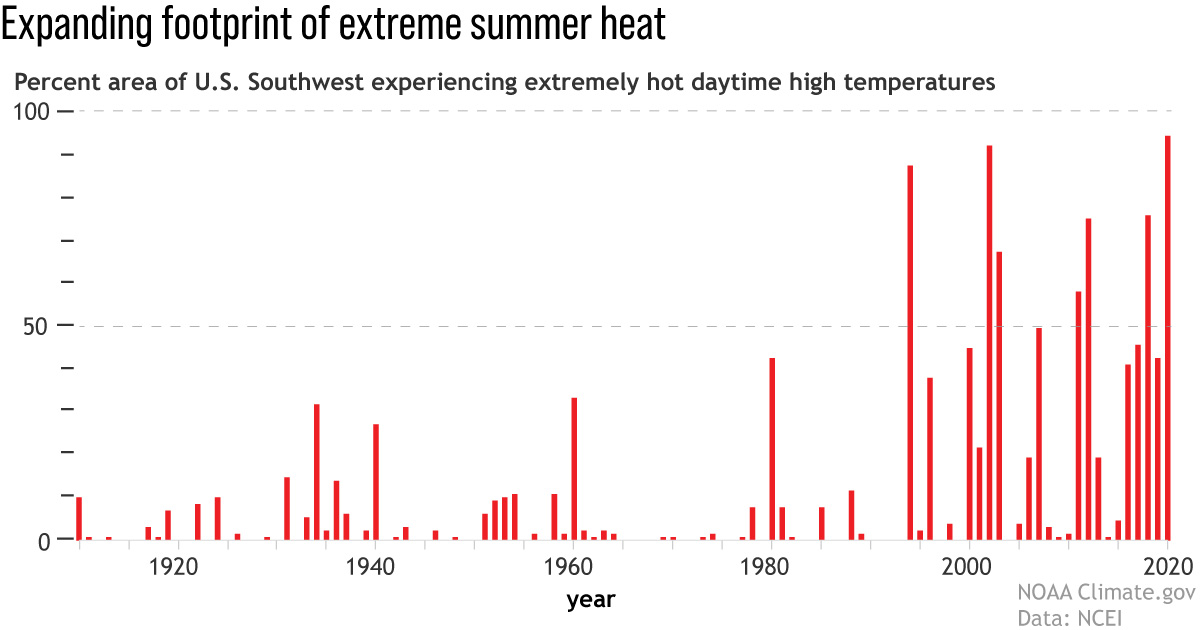
Red bars show the percent of the U.S. Southwest (Colorado, Utah, Arizona, and New Mexico) having extremely warm days--daytime high temperatures in the top ten percent of the historical record--each summer since 1910. The footprint of extreme heat in the Southwest has exploded in the past 30 years. NOAA Climate.gov graph, based on data from NCEI's Climate Extremes Index.