Image caption
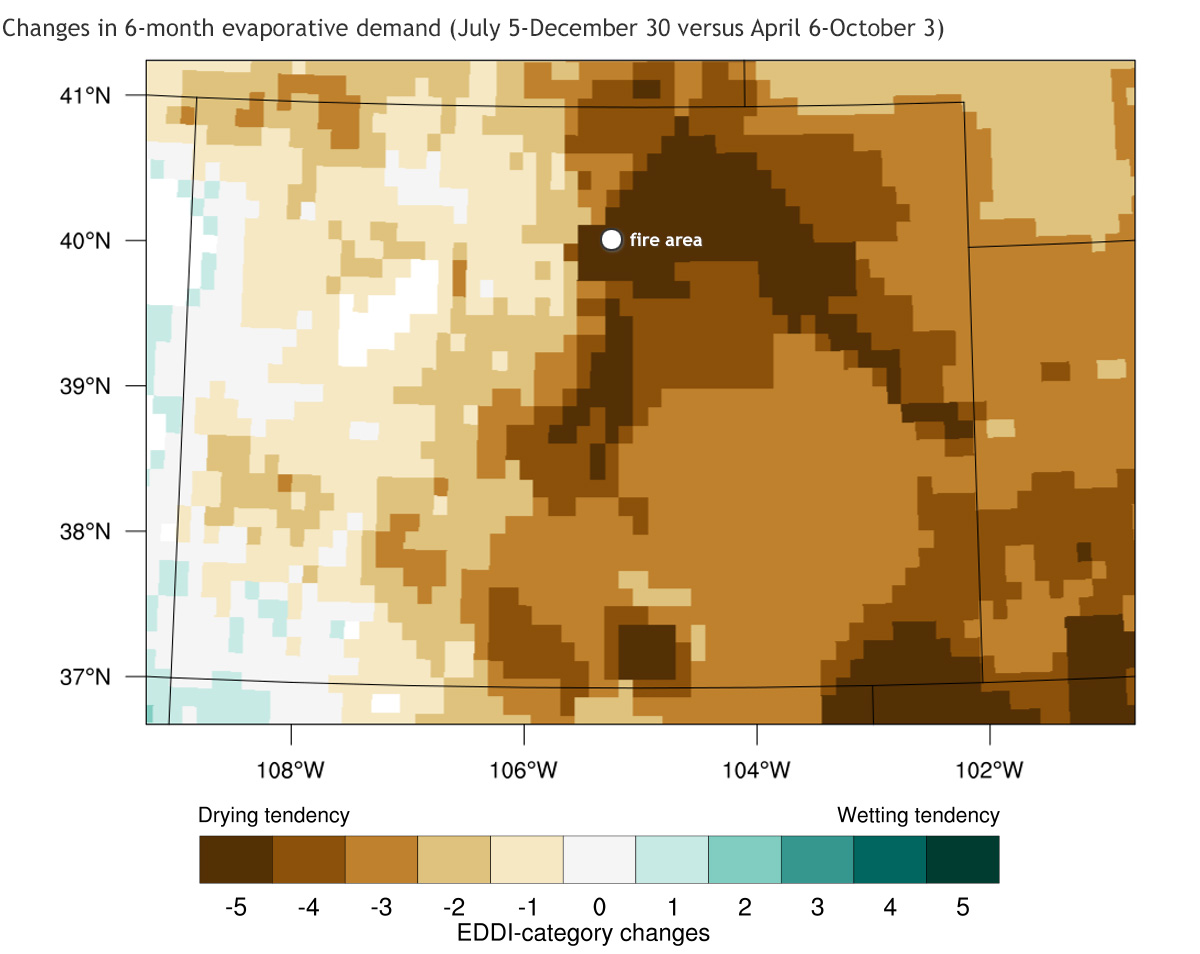
This map shows the change in NOAA's Evaporative Demand Drought Index (EDDI for short) for two overlapping 6-month periods: July 5-December 30 versus April 6-October 3. Evaporative demand—how "thirsty" the atmosphere is for moisture—in the area of the Marshall Fire was at record-high levels at the end of December 2021 as a result of extreme warmth and dryness over the fall. Image by Mike Hobbins, NOAA/ESRL Physical Sciences Laboratory. For background on EDDI, see the reference: Hobbins MT, Wood AW, McEvoy DJ, Huntington JL, Morton CG, Anderson MC, and Hain CR (2016), The Evaporative Demand Drought Index: Part I - Linking drought evolution to variations in evaporative demand. Journal of Hydrometeorology, 17:1745-1761, doi:10.1175/JHM-D-15-0121.1.