File name: AMV_versus_SSTA_pattern.jpg
Original Resolution: 1500 × 1776
File Size: 393 KB (MIME Type: image/jpeg)
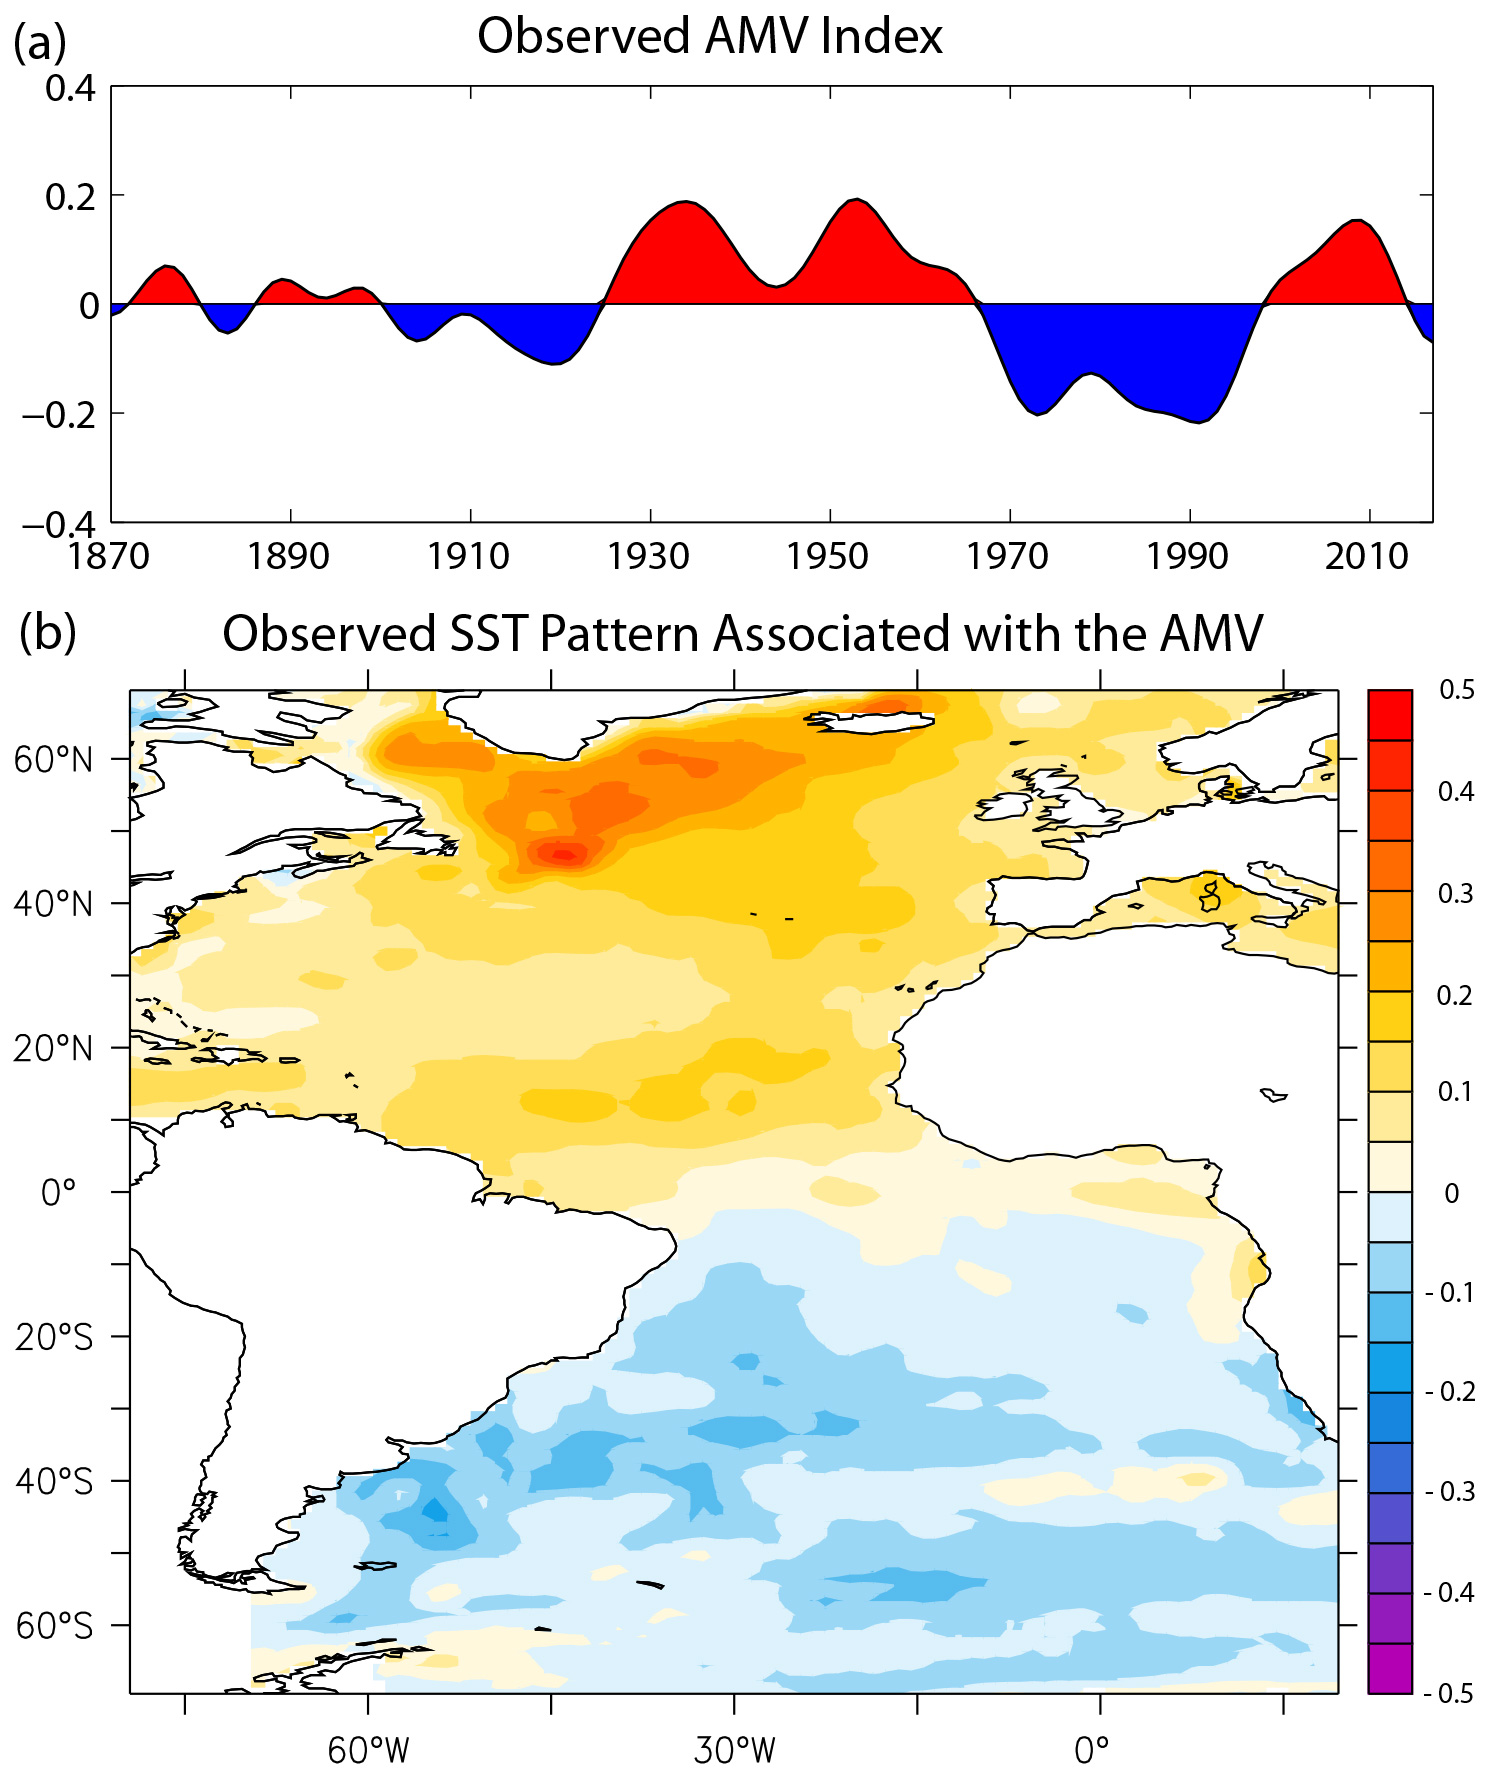
(top) Observed state of the Atlantic Multi-decadal Variability (AMV) Index from 1870 through 2017, with positive years colored red and negative years colored blue. (bottom) Difference from average sea surface temperatures in the Atlantic Ocean during the positive phase of the pattern, showing warmer-than-average temperatures north of the equator and cooler-than-average temperatures to the south. The temperature anomalies are reversed during the negative phase. Image from Zhang et al., 2019.