
Image caption
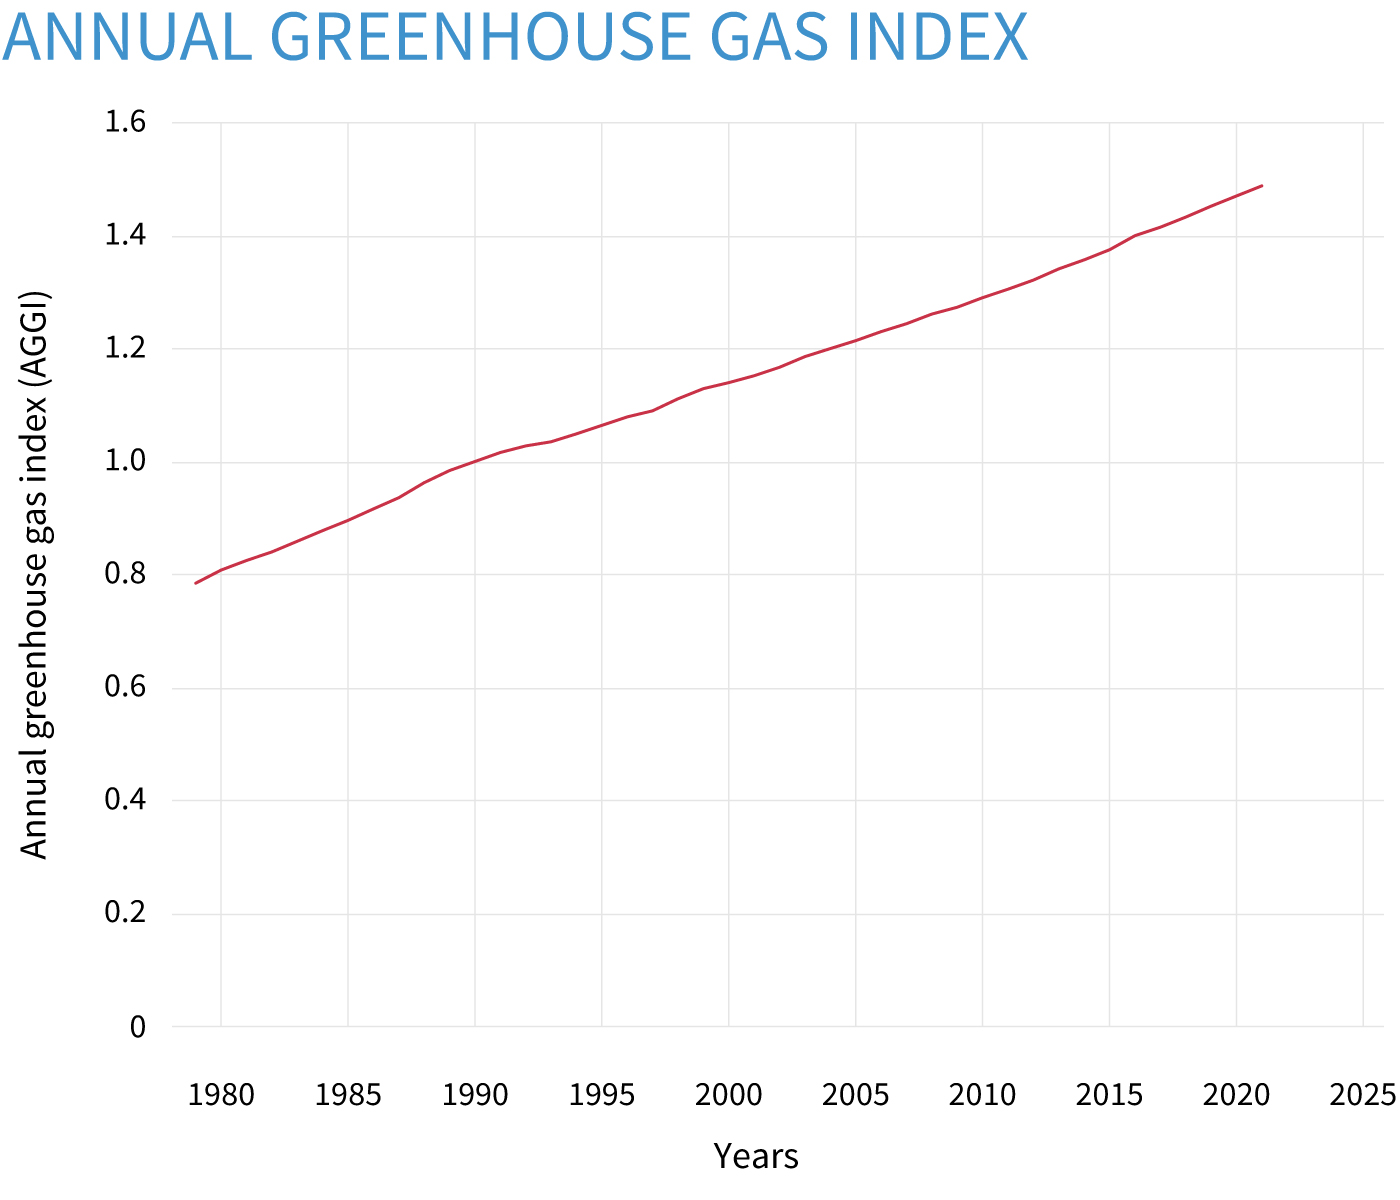
The AGGI—short for Annual Greenhouse Gas Index—reports the combined warming influence of all long-lived greenhouse gases as a fraction of their influence in 1990. NOAA Climate.gov graph, based on data from NOAA Global Monitoring Lab.
The AGGI—short for Annual Greenhouse Gas Index—reports the combined warming influence of all long-lived greenhouse gases as a fraction of their influence in 1990. NOAA Climate.gov graph, based on data from NOAA Global Monitoring Lab.