File name: ONI_evolution_3yearNinasAug2022.jpg
Original Resolution: 1359 × 859
File Size: 177 KB (MIME Type: image/jpeg)
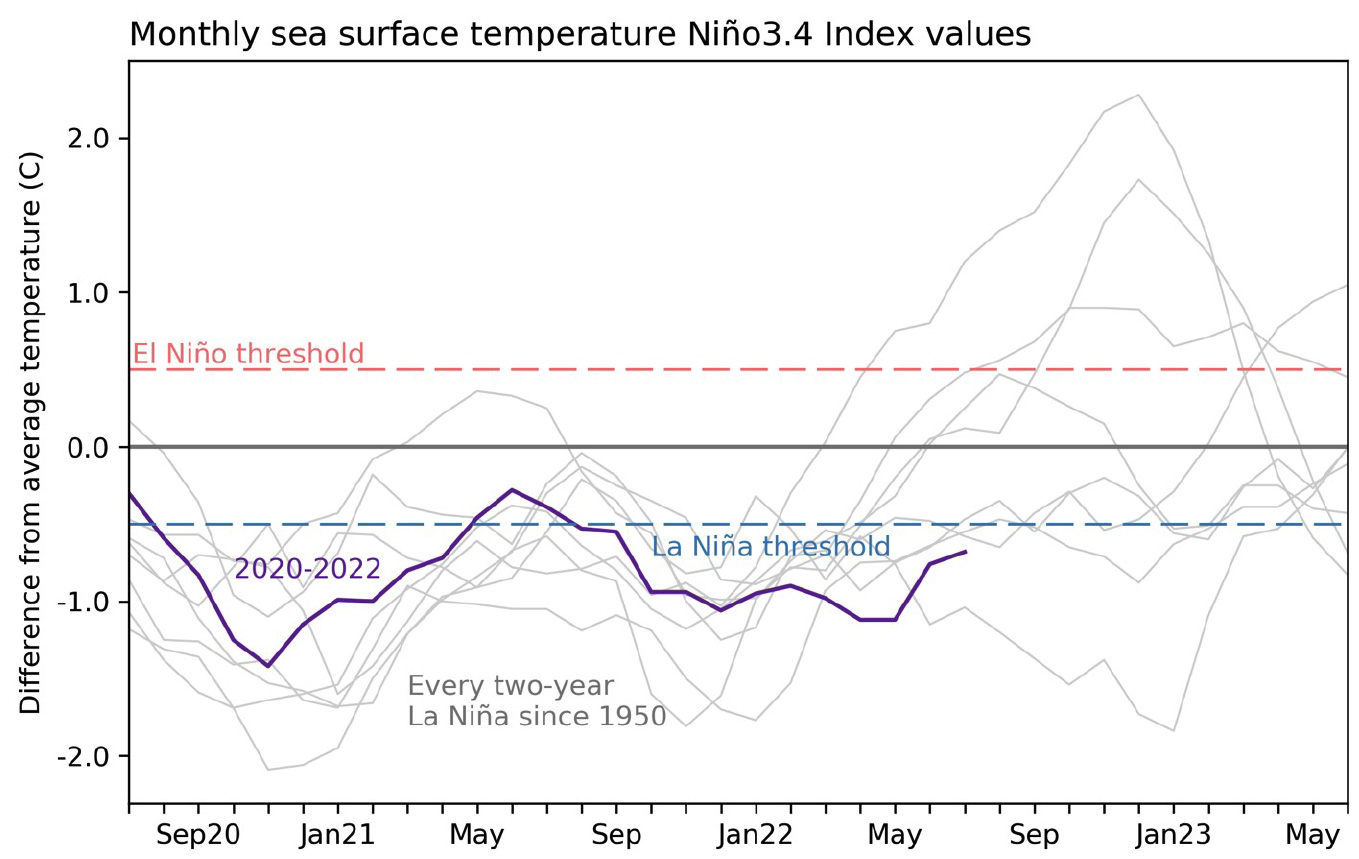
Three-year history of sea surface temperatures in the Niño-3.4 region of the tropical Pacific for the 8 existing double-dip La Niña events (gray lines) and the current event (purple line). Of all the previous 7 events, 2 went on to La Niña in their third year (below the blue dashed line), 2 went on to be at or near El Niño levels (above the red dashed line) and three were neutral. Graph is based on monthly Niño-3.4 index data from CPC using ERSSTv5. Created by Michelle L’Heureux.