File name: CO2-emissions-in-world-energy-outlook-scenarios-over-time-2000-2050_851px.png
Original Resolution: 851 × 536
File Size: 32 KB (MIME Type: image/png)
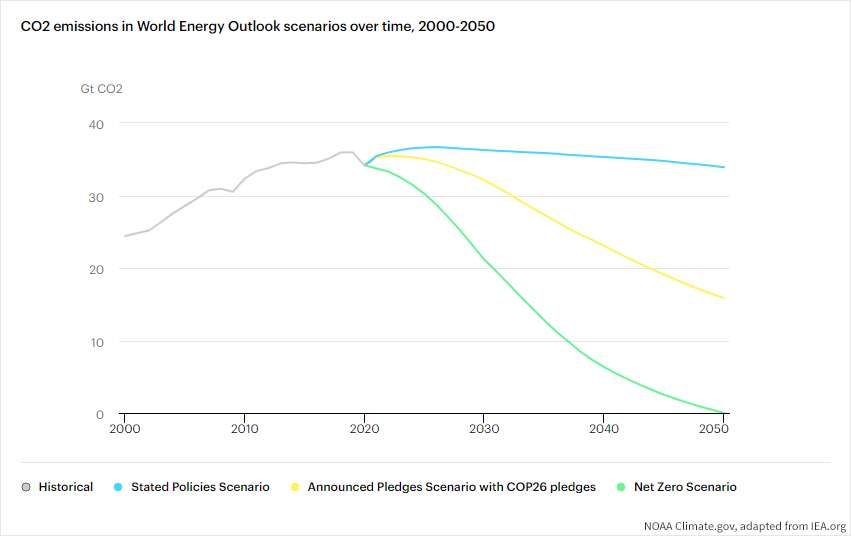
Global annual carbon dioxide emissions since 2000 (gray line) and possible future pathways. The blue line shows projected future emissions based on only on countries' stated policies (in place or in development) to reduce emissions. The yellow line shows emissions based on what COP countries pledged to do following COP26 in 2021. The green line shows how quickly emissions will need to drop for the global economy to reach net zero carbon dioxide emissions by 2050. NOAA Climate.gov graphic, derived from original by the International Energy Administration from their 2022 World Energy Outlook. Climate.gov is solely liable and responsible for this derived work. Used under a Creative Commons license.