File name: Global_October2022_tempanom_map_graph.png
Original Resolution: 2000 × 2058
File Size: 611 KB (MIME Type: image/png)
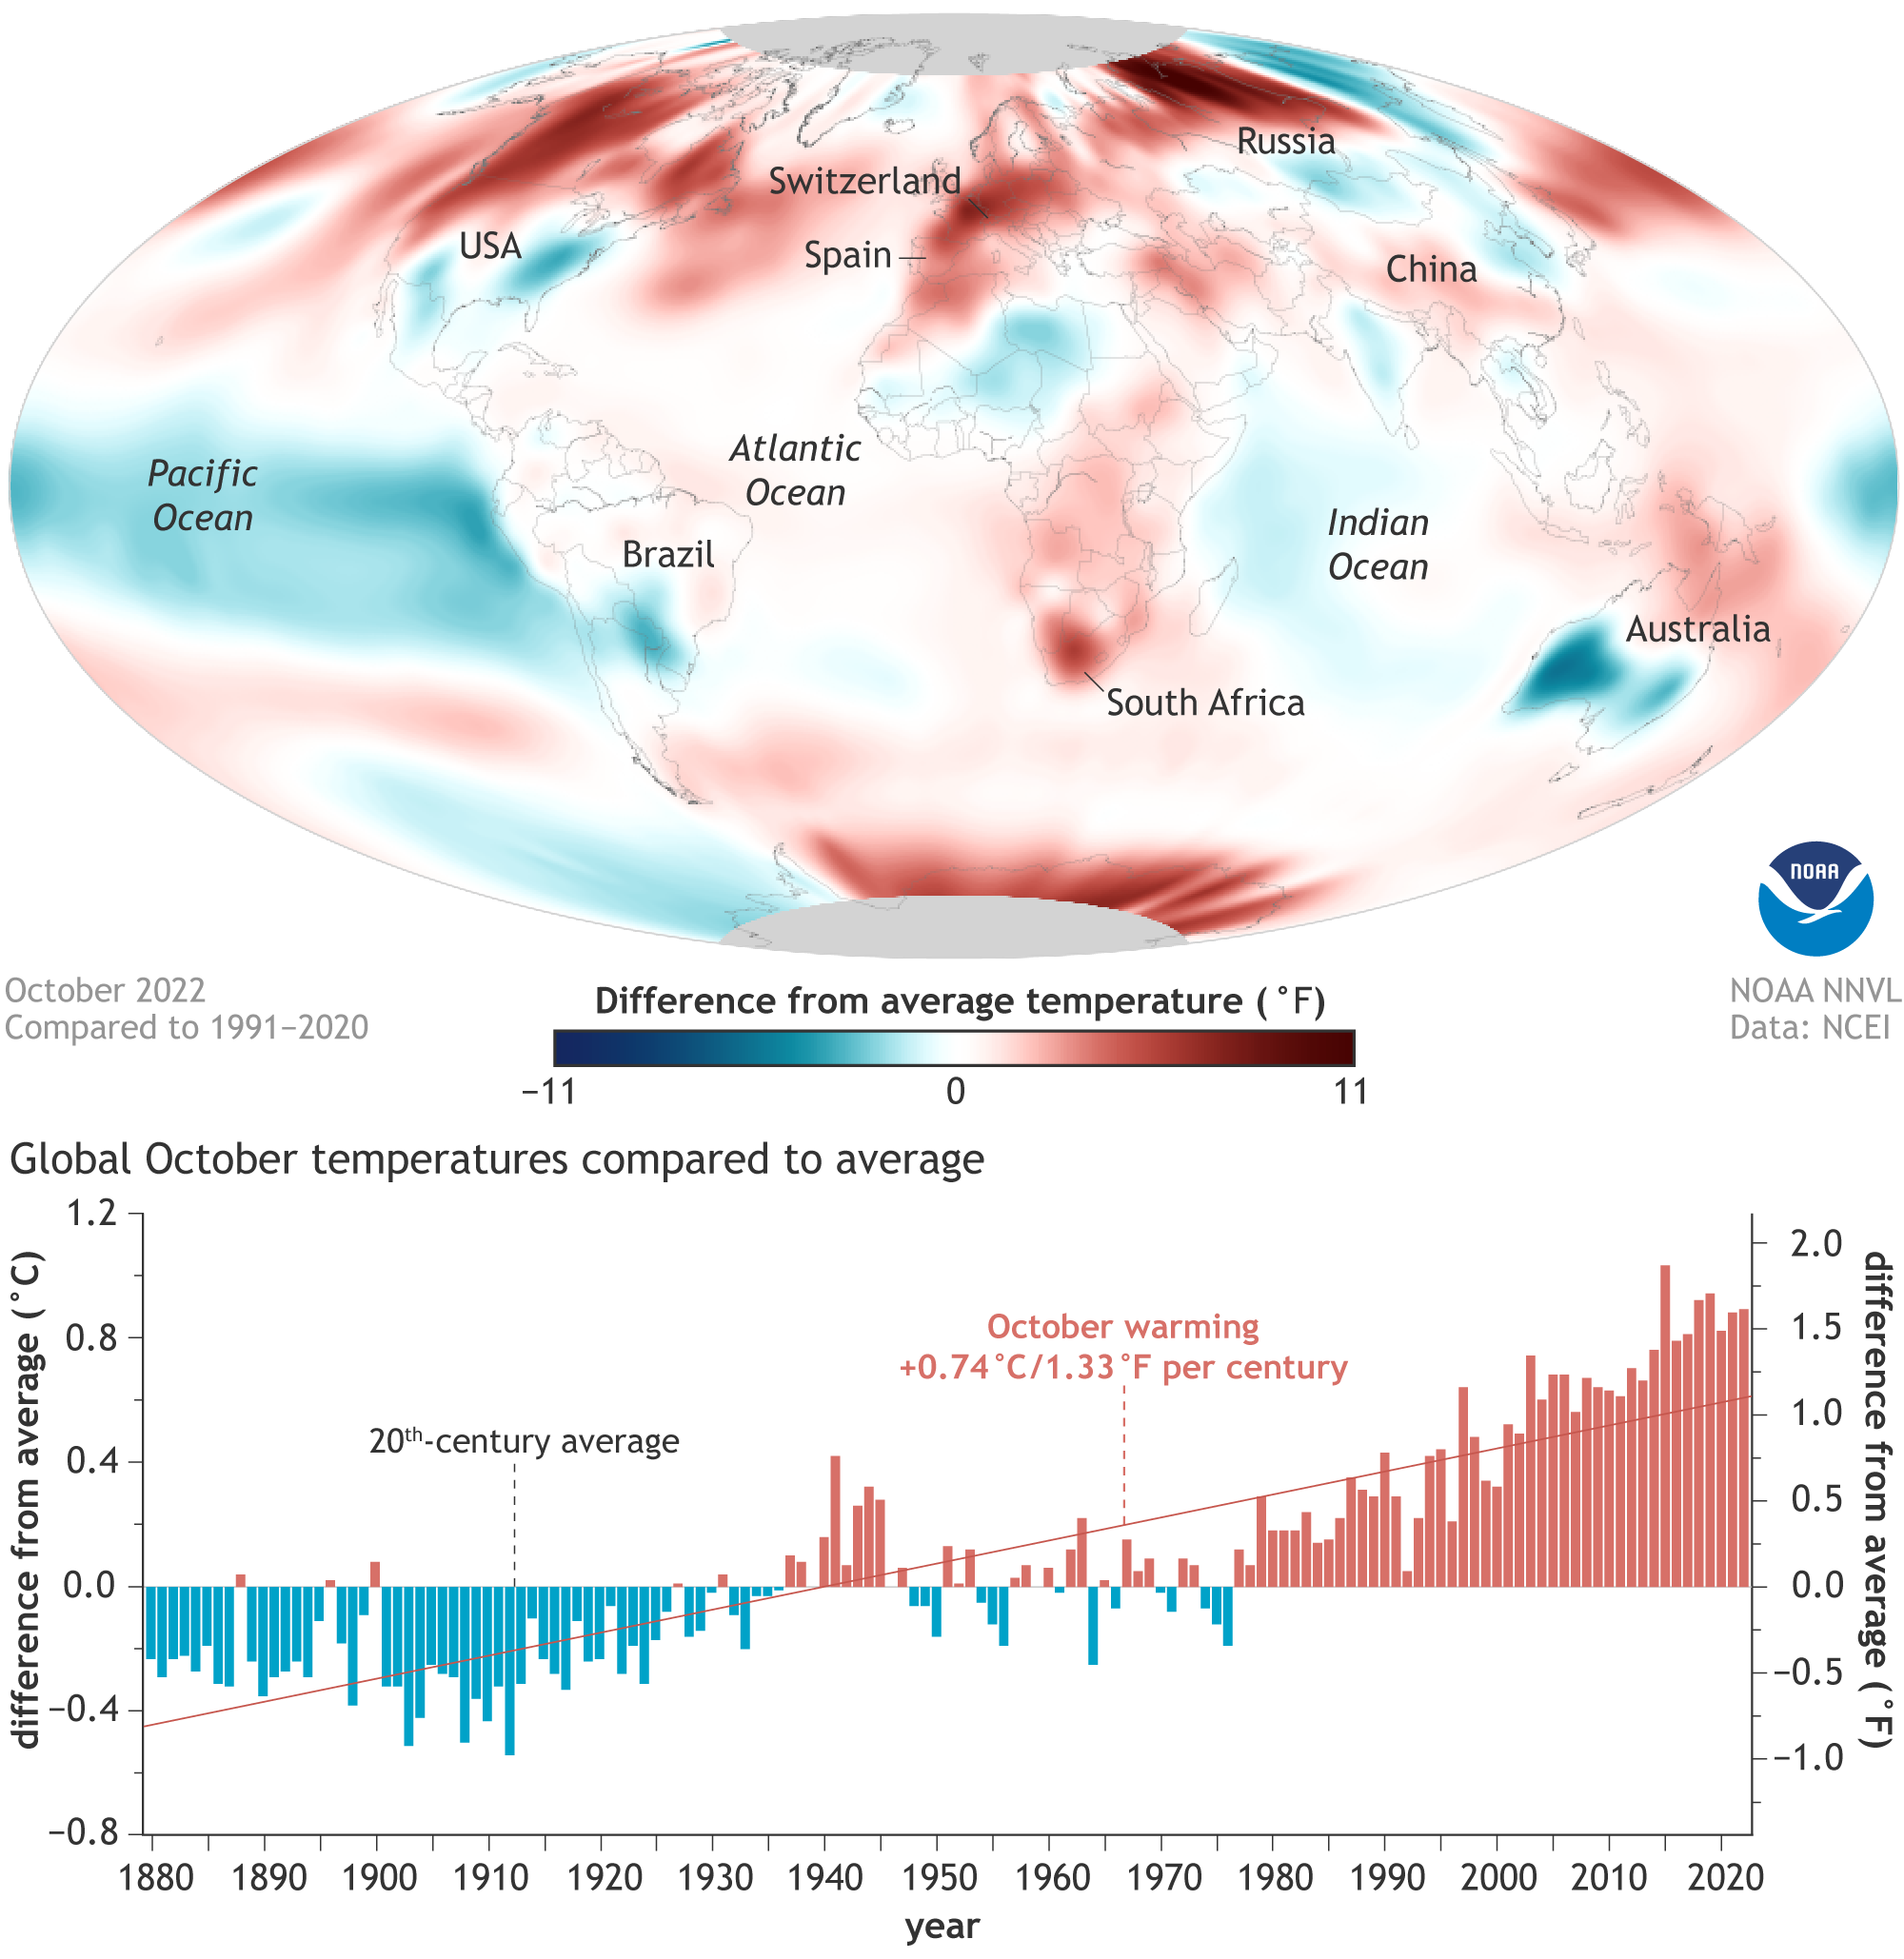
(top) Temperatures in October 2022 compared to the 1991-2020 average, with places that were warmer than average colored red and places that were cooler than average colored blue. (bottom) October temperatures compared to the 20th-century average for each year from 1880 to 2022. NOAA Climate.gov image, based on data from NOAA National Centers for Environmental Information.