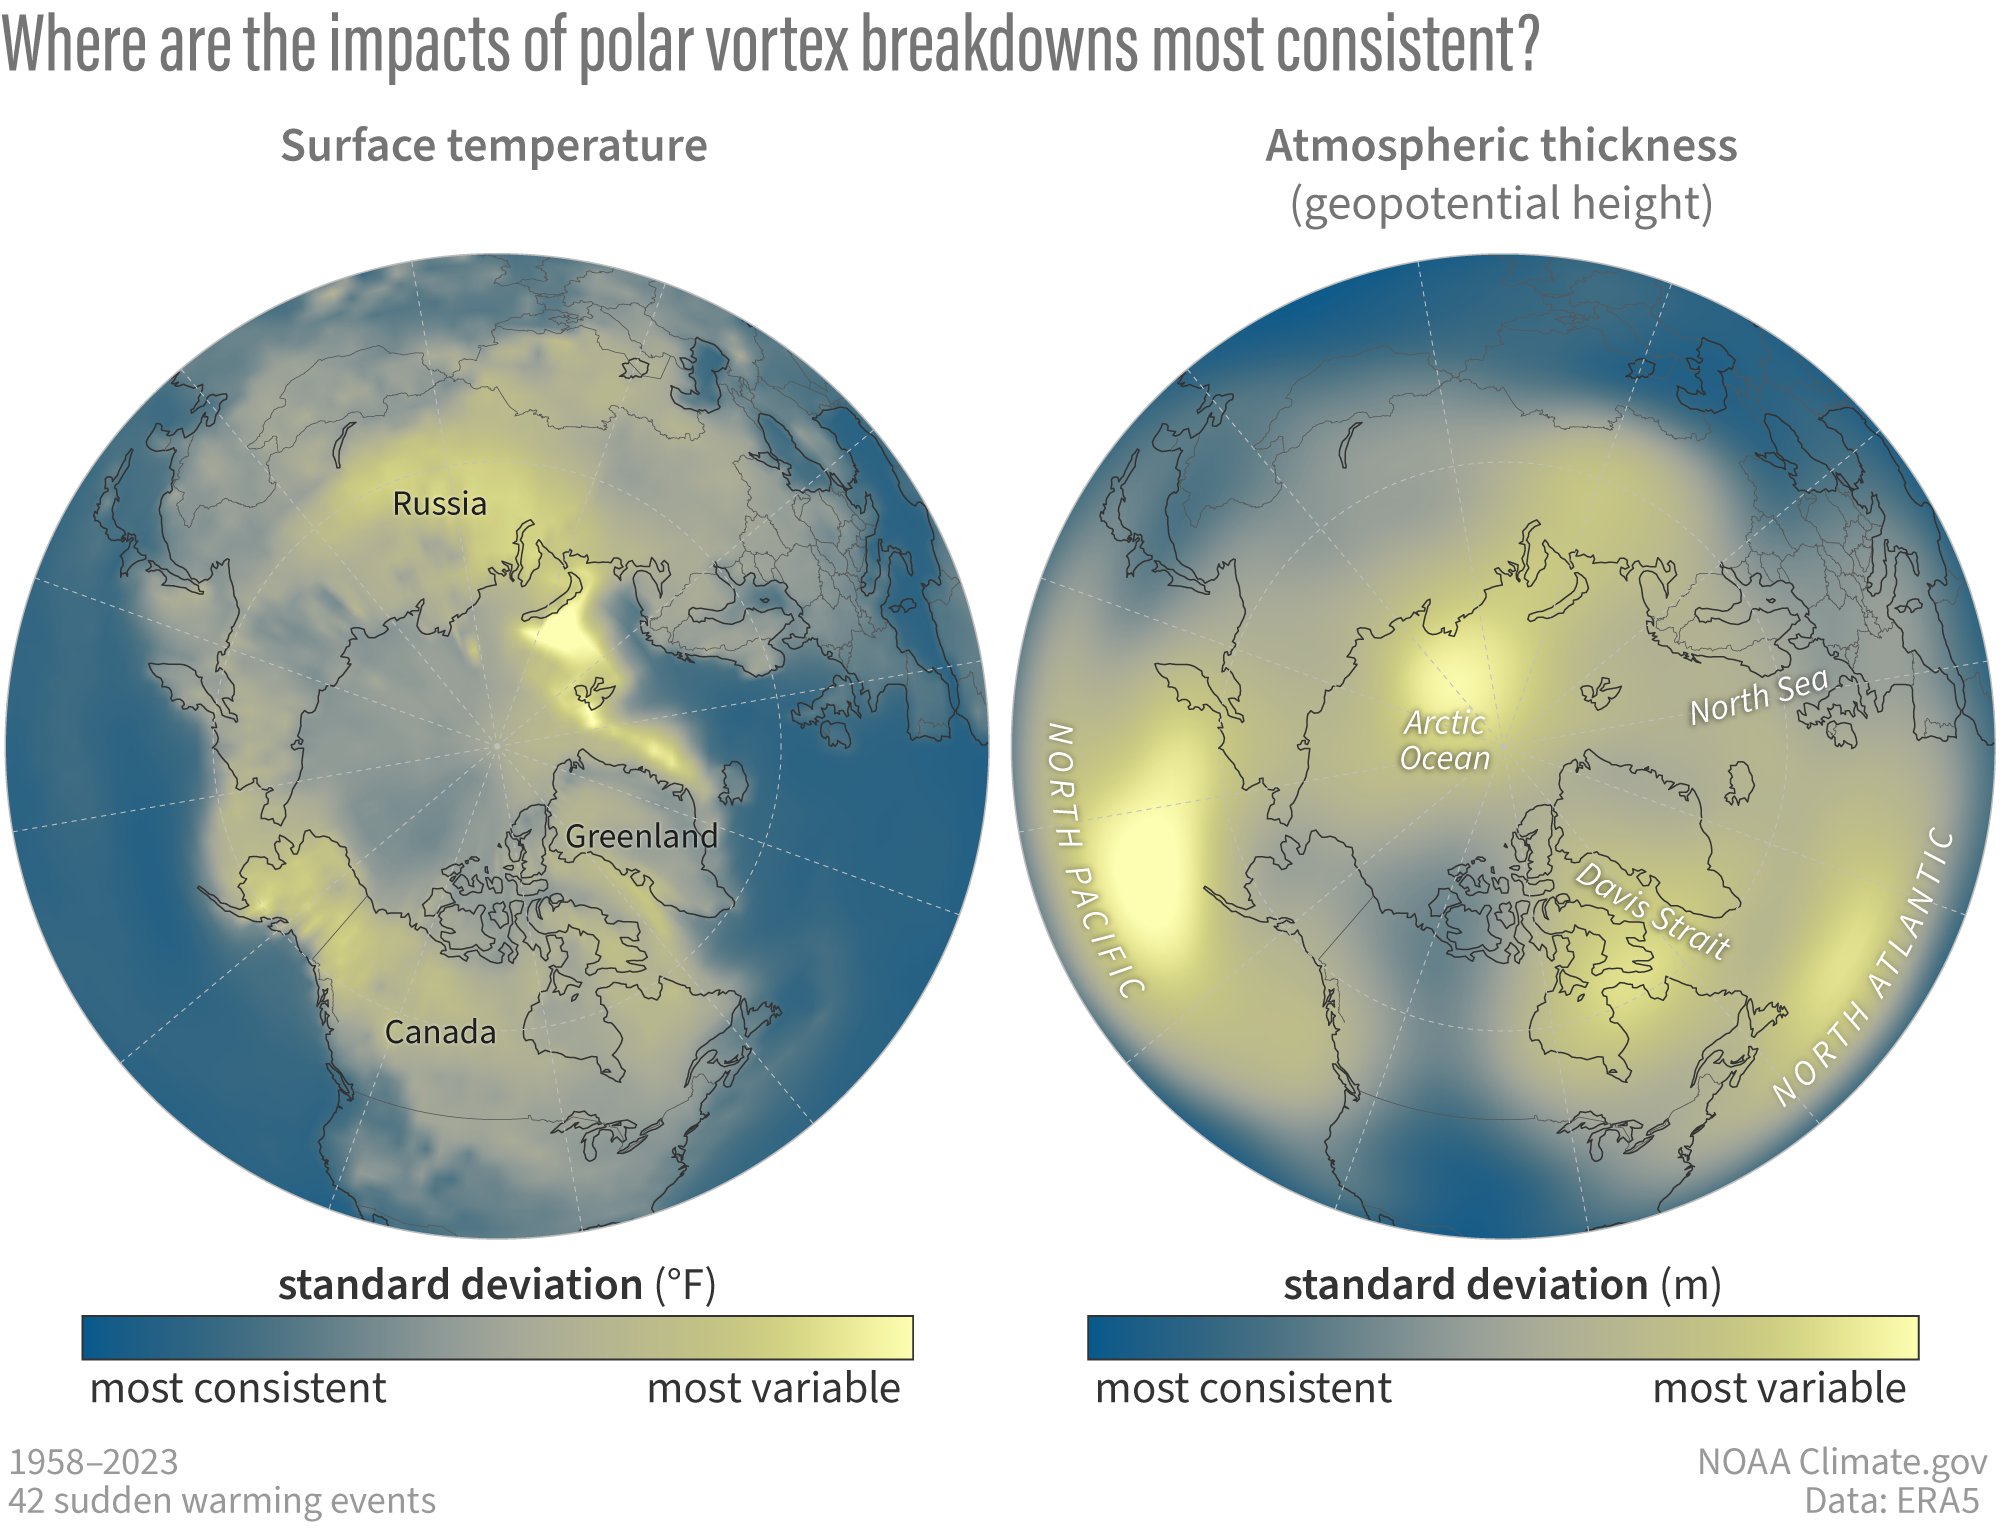
Where do the surface temperatures and atmospheric thickness (at the 500-hectoPascal pressure level) vary the most from one major warming event to another? These maps show where the standard deviation, a measure of the variability, is greatest across events (for the 30-day averaged period after the 42 observed major warmings in the 1958-2023 period). Surface temperatures (left) show high event-to-event variability across the central Arctic, Russia, and Alaska. The high variability over the central Arctic likely reflects changing sea ice conditions over this period. Atmospheric thickness (right) shows high event-to-event variability over Greenland and the North Atlantic, and the North Pacific. The high event-to-event variability over Alaska and the Pacific region likely reflects the varying El Nino-Southern Oscillation conditions that occurred during the 42 major warming events, which get averaged out in the first figure in this post. NOAA Climate.gov image based on ERA5 reanalysis data provided by Amy Butler.