File name: Wetness5-2014_610.jpg
Original Resolution: 610 × 470
File Size: 272 KB (MIME Type: image/jpeg)
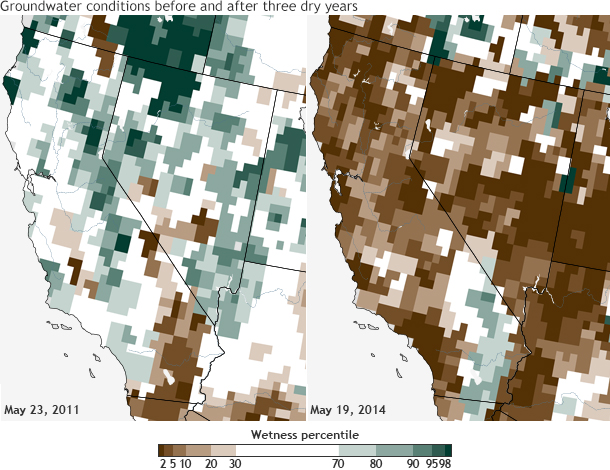
These maps show water stored in underground aquifers on May 23, 2011, and after three consecutive dry years on May 19, 2014, compared to the historical range for comparable weeks from 1948 to 2009. Areas where the groundwater storage was near the higher end of the historic range are shades of green while areas where the water storage (wetness percentile) was near the lower end of the range are shades of brown. Maps by Climate.gov, based on modeled groundwater indicator data from the Gravity Recovery and Climate Experiment (GRACE).