Image caption
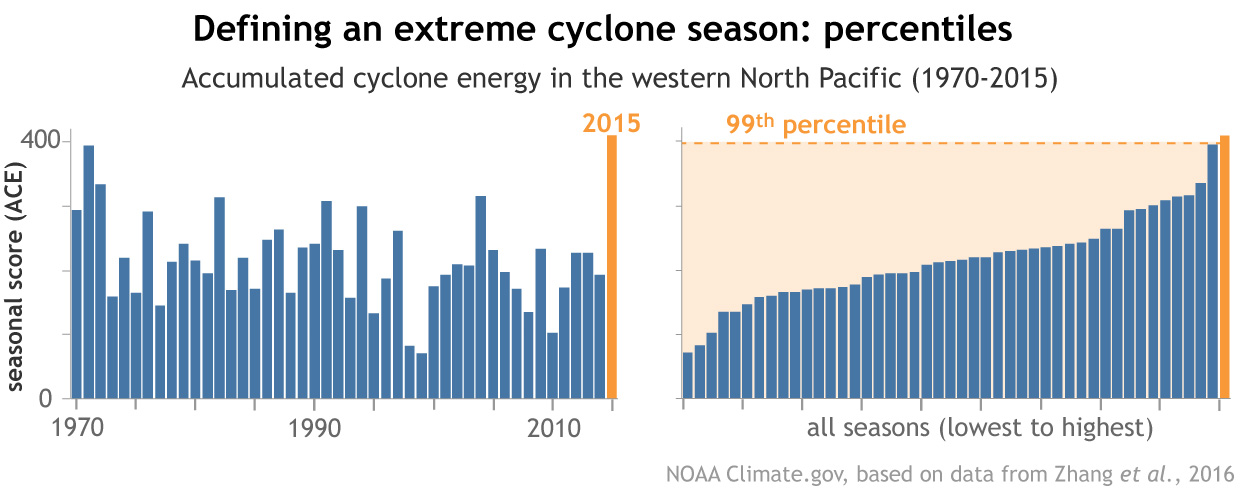
In the 2016 issue of Explaining Extreme Events from a Climate Perspective, climate scientists used percentiles to classify the extremely active 2015 cyclone (hurricane) season in the western North Pacific. (left) Each season was given an “accumulated cyclone energy” score that accounted for storm intensity and duration. (right) Sorting the scores from lowest to highest shows that 2015’s score of more than 400 (orange bar) was a “99th percentile” event: 99% of scores in the historical record were lower than 2015. Graph based on “best track” data from the Shanghai Typhoon Institute (STI) provided by Wei Zhang.