File name: CentralUSprecip_sigmas_1000.png
Original Resolution: 1000 × 1161
File Size: 476 KB (MIME Type: image/png)
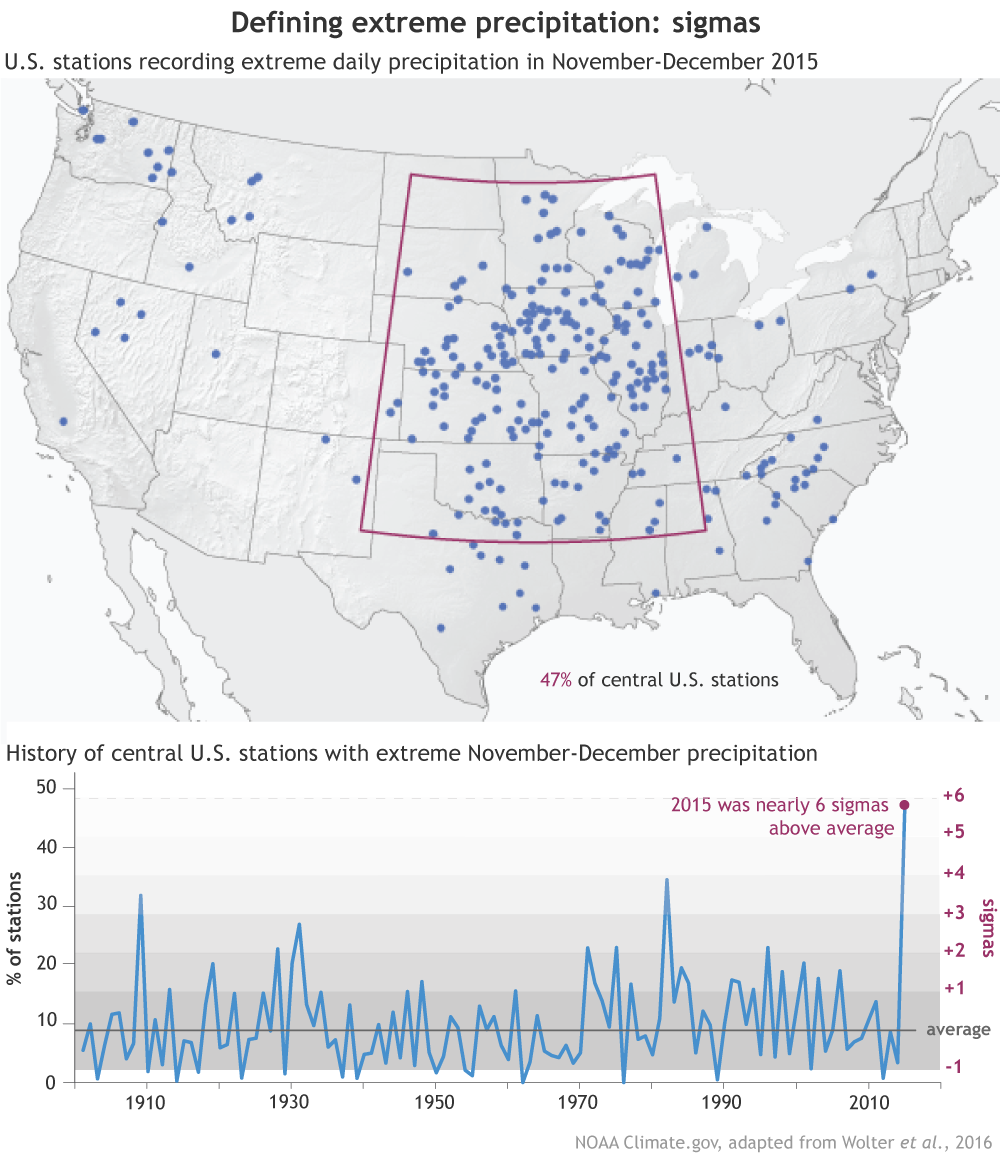
Sigmas are a way of describing the range of natural variability in a climate characteristic. (map) In 2015, nearly half of central U.S. stations with at least a 100-year history recorded extreme precipitation in November-December according to a NOAA analysis [link to study when available]. (graph) More than half of the years on record are within plus or minus 1 sigma (darkest shading) of the average (gray line). Only a handful of years are outside of 2 sigmas. At nearly +6 sigmas from average, the 2015 season (purple dot) was far outside the range of normal variability. NOAA Climate.gov graphic adapted from Figures A1.1(h) and A1.2 (e) in Wolter et al., 2016.