Drought breaks out this fall
Drought has erupted in the Southeast United States in recent months, and emerged in the central plains in recent weeks. Forest fires have dotted the Southern Appalachians. Areas not directly threatened by the fires have dealt with the downstream consequences. Many places—including here in Asheville—have seen an almost uninterrupted run of air quality alerts. My part of the country now faces some of the same challenges many Californians have been battling for several years.
How we got there
The short version of how we got there, and this isn’t meant to sound flippant, is that it’s been dry and warm.
Take a look at October’s “percent of normal” precipitation map. The darkest brown color painted over much of the south—and nearly all of Alabama—and parts of the central and southern high plains represents less than 5% of normal rainfall. In other words, less than one part out of twenty of October’s average rainfall. In the south, October was an exclamation point at the end of a dry stretch dating to summer.
October's precipitation deficits intensified drought in the south and caused drought to emerge in the southern high plains.
It’s also been warm. Again, comparing to the “normal” October, both regions were warmer than average.
Temperature versus normal for October 2016. Areas in red were warmer than normal for October; those in blue were cooler than normal for October. The darker the shade, the larger the difference from normal.
Supply and Demand
It’s an important combination: dry is bad, but warm and dry is worse. The lack of precipitation represents the supply side of the drought equation. On the flip side of that coin: a warmer atmosphere is a thirstier atmosphere, and will demand more water from soils and plants. That’s the “demand” side of drought.
Things haven’t gotten better since October. The following stations have broken—as of November 15th—their longest stretches of days.
|
Station |
State |
Days without Measurable Precipitation |
|
Dallas 7 NE |
Georgia |
57 |
|
Alexander City |
Alabama |
57 |
|
Demopolis Lock & Dam |
Alabama |
49 |
|
Warrior Lock & Dam |
Alabama |
58 |
|
Logan | Martin Dam |
Alabama |
57 |
|
Mitchell Dam |
Alabama |
48 |
|
Muscle Shoals |
Alabama |
25 |
|
Oneonta |
Alabama |
86 |
|
Sylacauga 4NE |
Alabama |
57 |
|
Tuscaloosa | Oliver Dam |
Alabama |
58 |
|
Weiss Dam |
Colorado |
49 |
|
Black Forest 6WNW |
Colorado |
39 |
|
Monument 3S |
Colorado |
44 |
|
Shaw 4NE |
Colorado |
43 |
|
Wild Horse 6N |
Colorado |
34 |
|
Woodrow 6NNE |
Colorado |
34 |
|
Monticello 10SW |
Florida |
30 |
|
New Hope |
Florida |
57 |
|
Adairsville 5SE |
Georgia |
48 |
|
Allatoona Dam |
Georgia |
30 |
|
Cedartown |
Georgia |
87 |
|
Crisp County Power |
Georgia |
49 |
|
Doraville 2NNE |
Georgia |
38 |
|
Georgetown 4E |
Georgia |
49 |
|
Germany Valley |
Georgia |
25 |
|
Jackson Dam |
Georgia |
57 |
|
Jasper 1NNW |
Georgia |
57 |
|
Rome |
Georgia |
49 |
|
Sautee 3W |
Georgia |
31 |
|
Tugalo Dam |
Georgia |
38 |
|
Coon Rapids |
Iowa |
35 |
|
New Ulm 3SE |
Minnesota |
16 |
|
Willmar 5N |
Minnesota |
16 |
|
Forest City |
North Carolina |
38 |
|
Old Fort Agricultural Stn |
North Carolina |
38 |
|
Bismarck 2NNW |
North Dakota |
19 |
|
Centerville 4NE |
Tennessee |
24 |
|
Carrollton |
Georgia |
48 |
|
Russell Springs 3N |
Kansas |
34 |
|
Duluth Natl Weather Service |
Minnesota |
12 |
|
Chipley |
Florida |
47 |
|
Unicoi State Park |
Georgia |
29 |
|
Hendersonvill 1NE |
North Carolina |
38 |
|
Aberdeen 3E |
South Dakota |
16 |
Emerging drought also shows up in an interesting way in the October temperature data. Generally speaking, both minimum (morning) temperatures and maximum (afternoon) temperatures were above normal, but these side-by-side maps show just how historically unusual those temperatures were, relative to history.
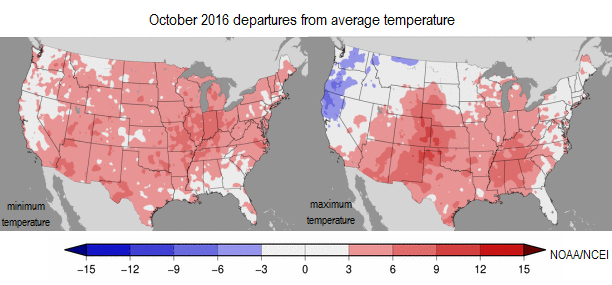
October 2016 departure from the 20th century October average for minimum (morning) temperature on the left, and maximum (afternoon) temperature on the right. Red shades depict areas warmer than the 20th century average for October. Blue shades depict areas that were cooler.
In the droughty areas, especially in the South, morning temperatures were warmer than normal, but afternoon temperatures were record-warm or nearly so. This is typical of drought: drier areas, all else being equal, tend to see a larger temperature range (relatively cooler mornings, relatively warmer afternoons). This is because a drier atmosphere tends to allow more “radiational cooling” overnight. During the day, drier soils and plants mean that less of the sun’s energy goes into helping water evaporate, and more of it goes directly into raising the temperature.
This signal typically shows up more strongly in the summer, but in the South, October still has enough sunlight to get noticeably divvied up in this way.
Drought is different
Drought is a creeping hazard. Unlike many other weather hazards, which develop then arrive, drought develops around and between us.
Stop and think about that for a moment. It’s more important than it may seem at the surface.
Our hazardous weather warning philosophy—rightfully—typically adopts a spot-and-track-the-invader approach. We’re used to getting a heads-up about something moving toward us. Physically, moving toward us.
Drought is also more common than other weather hazards. We don’t see hurricanes or tornadoes every day, but there has been drought somewhere in the U.S. every day for many years. It’s a natural part of the climate system.
However, drought is different than other weather hazards in a more profound and challenging way. With the other hazards, the conflict is us (society) versus destructive force (weather hazard). With drought, the conflict is often us—full stop. It’s about who gets the water.
Even setting that big issue aside, different communities just see drought differently. Some communities like agriculture and fire management are sensitive to short-term drought. Others, like water supply managers, may be more worried about longer drought episodes than shorter and more severe ones.
Collaboration is key
If that sounds like a recipe for turning on each other, take heart. Drought management is a multi-layered approach—I work with the monitoring side, just one piece of the puzzle. When it’s done well, drought monitoring and management is a noisy process, with lots of dialogue from many parties with different perspectives.
Just in the narrow drought management slice called “monitoring,” the ultimate instrument for assessing drought, the weekly U.S. Drought Monitor, is a weekly portrait of perspectives: short-term versus long-term indicators, this dataset versus that dataset, data analysis versus boots-on-the-ground impacts.
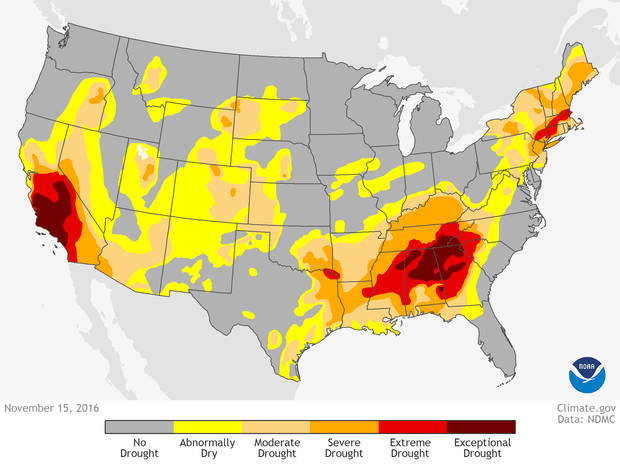
The weekly United States Drought Monitor assessment for November 15, 2016. Weekly drought maps available in our Data Snapshots map collection.
Is it perfect? No. Does it work better than anything else in human history? Yes.
It works better than anything else in human history because it is a sustained, respectful conversation that corrects itself as it goes. It does not confuse perfection with validity, and does not divorce what is seen in data and what is experienced in the real world. Instead, it reconciles these.
It’s a model for the climate services community as we go forward with assessing and managing all of the creeping hazards associated with our changing climate, which will form around and between us as much or more as they come at us.
It’s a model for successful management and successful services and successful decision-making that goes Beyond the Data into the age-old practices of communication and respect.
Comments
Add new comment