Detailed maps of urban heat island effects in Washington, DC, and Baltimore
NOAA's Office of Oceanic and Atmospheric Research published a new story on the NOAA website today about a volunteer "citizen science" project that took place this summer to create highly detailed maps of the urban heat island effect in Washington, DC, and Baltimore, MD. According to the story…
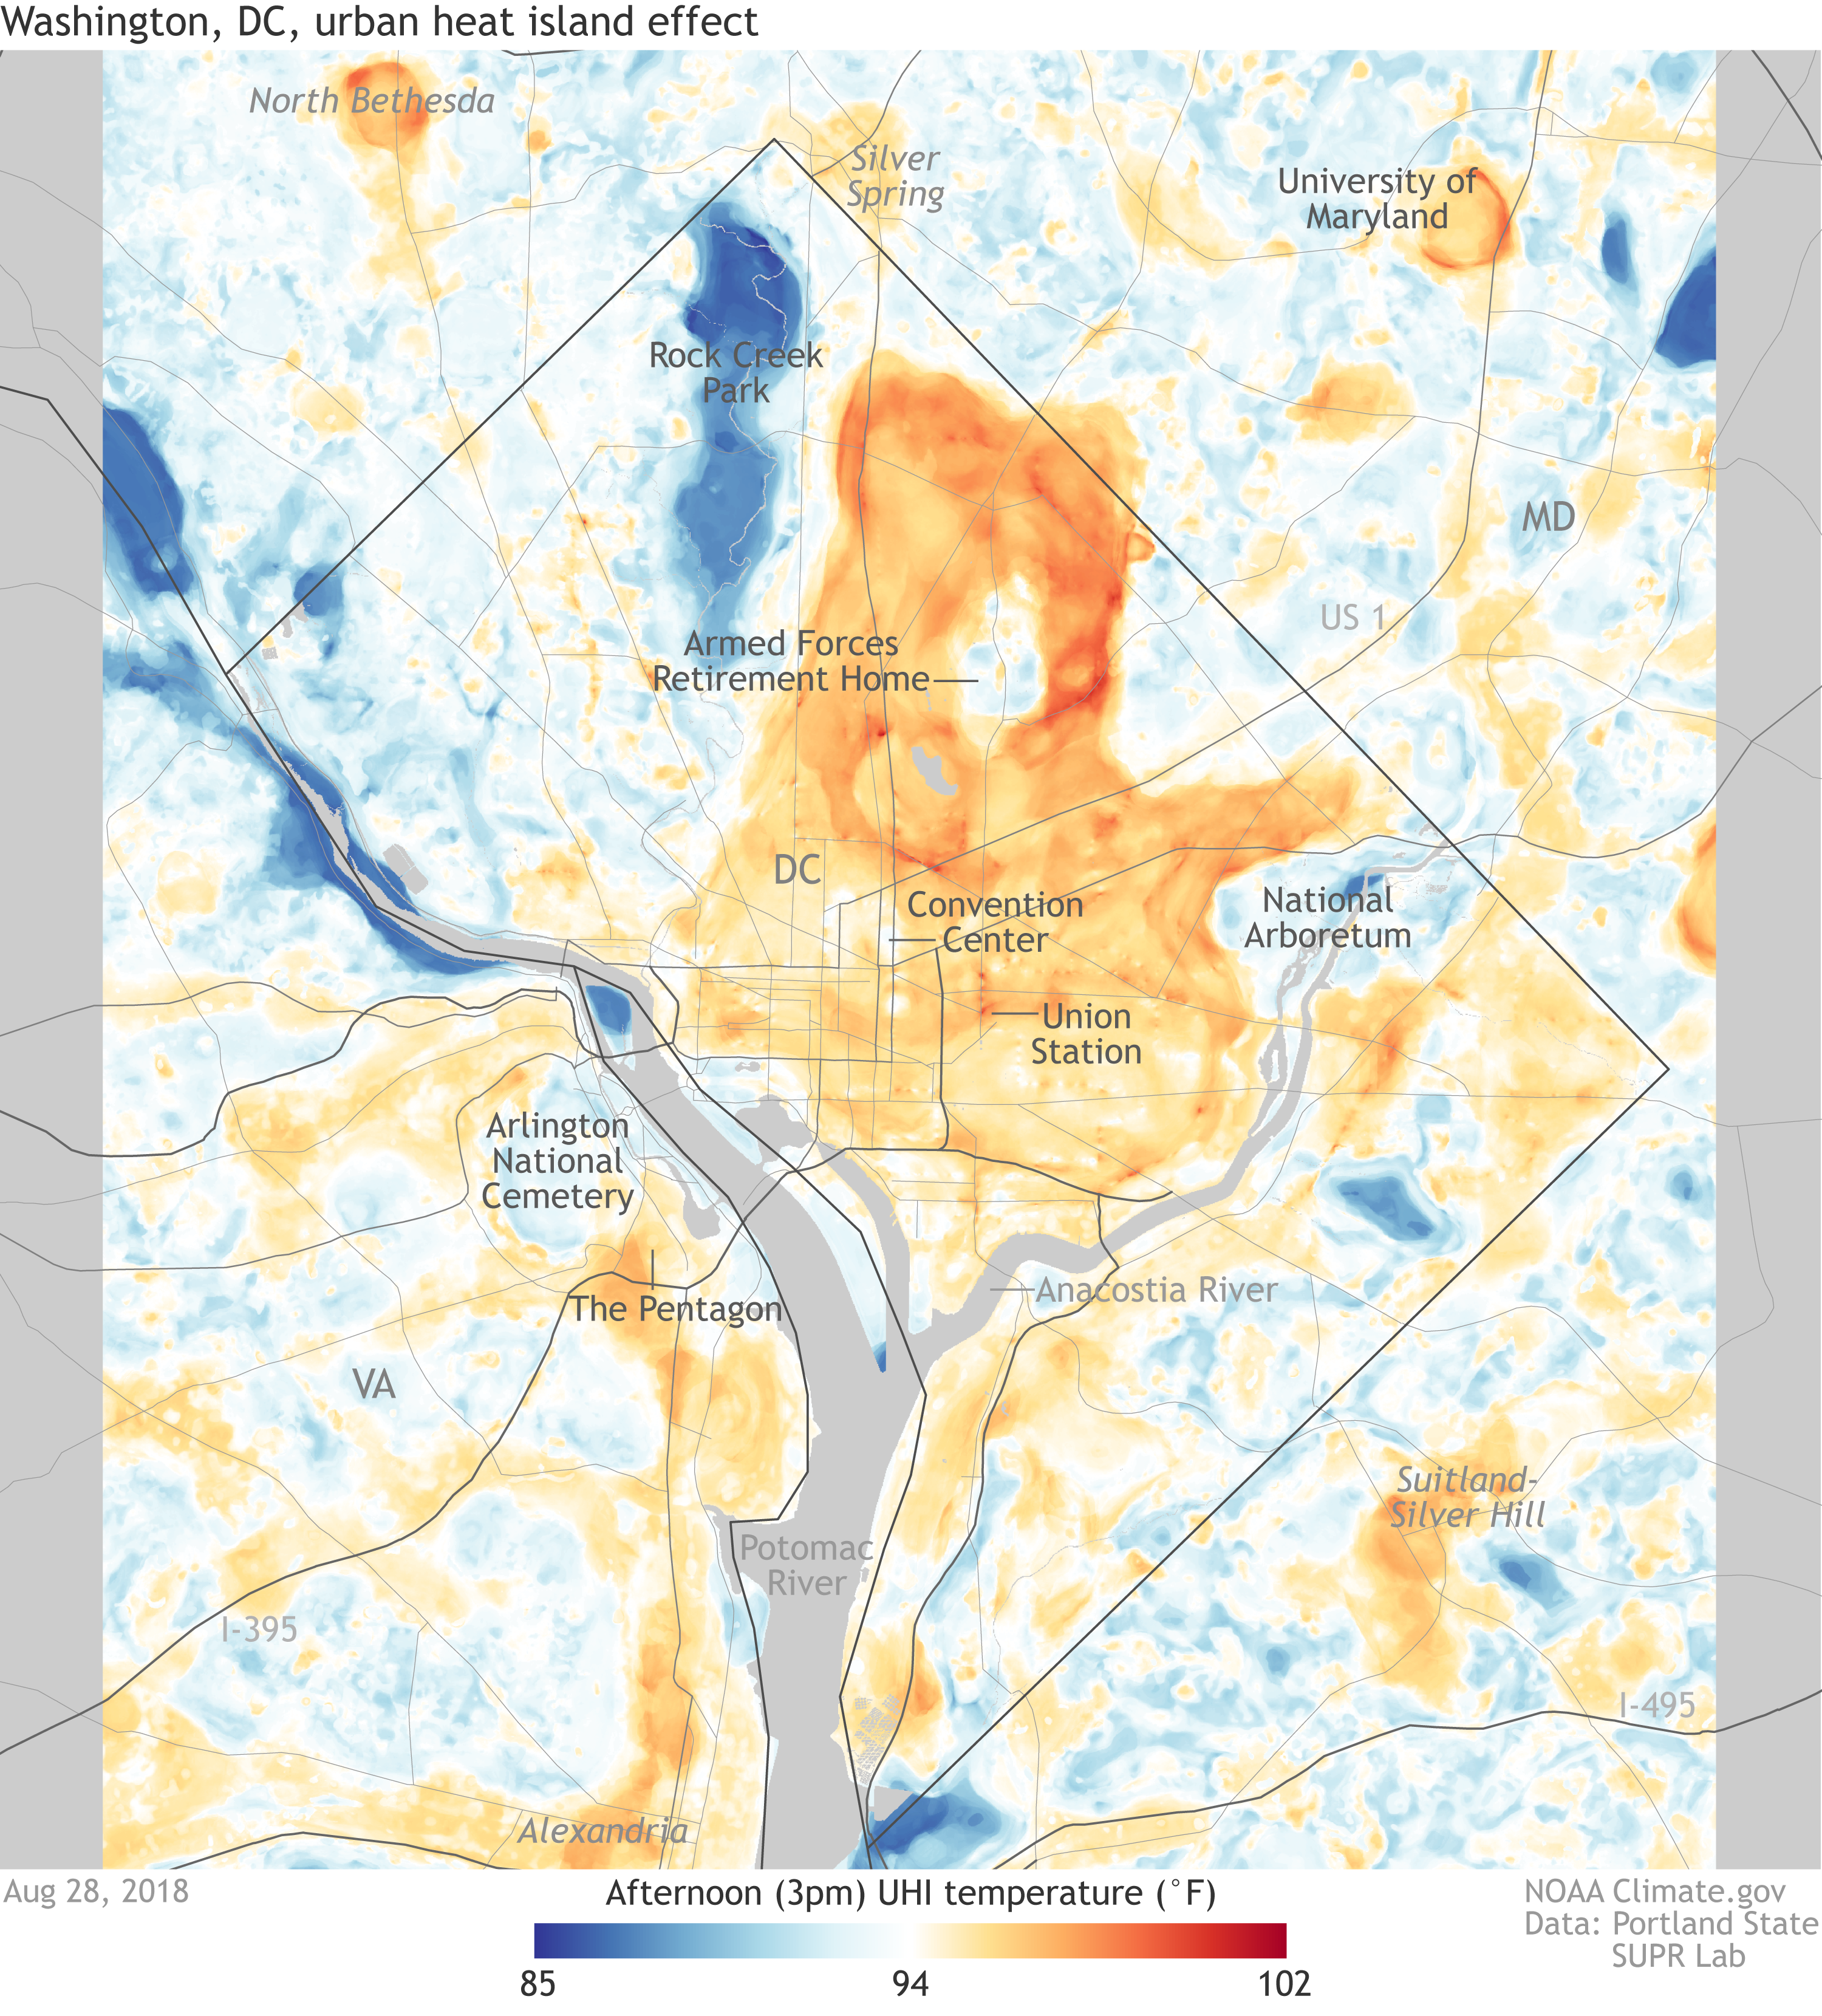
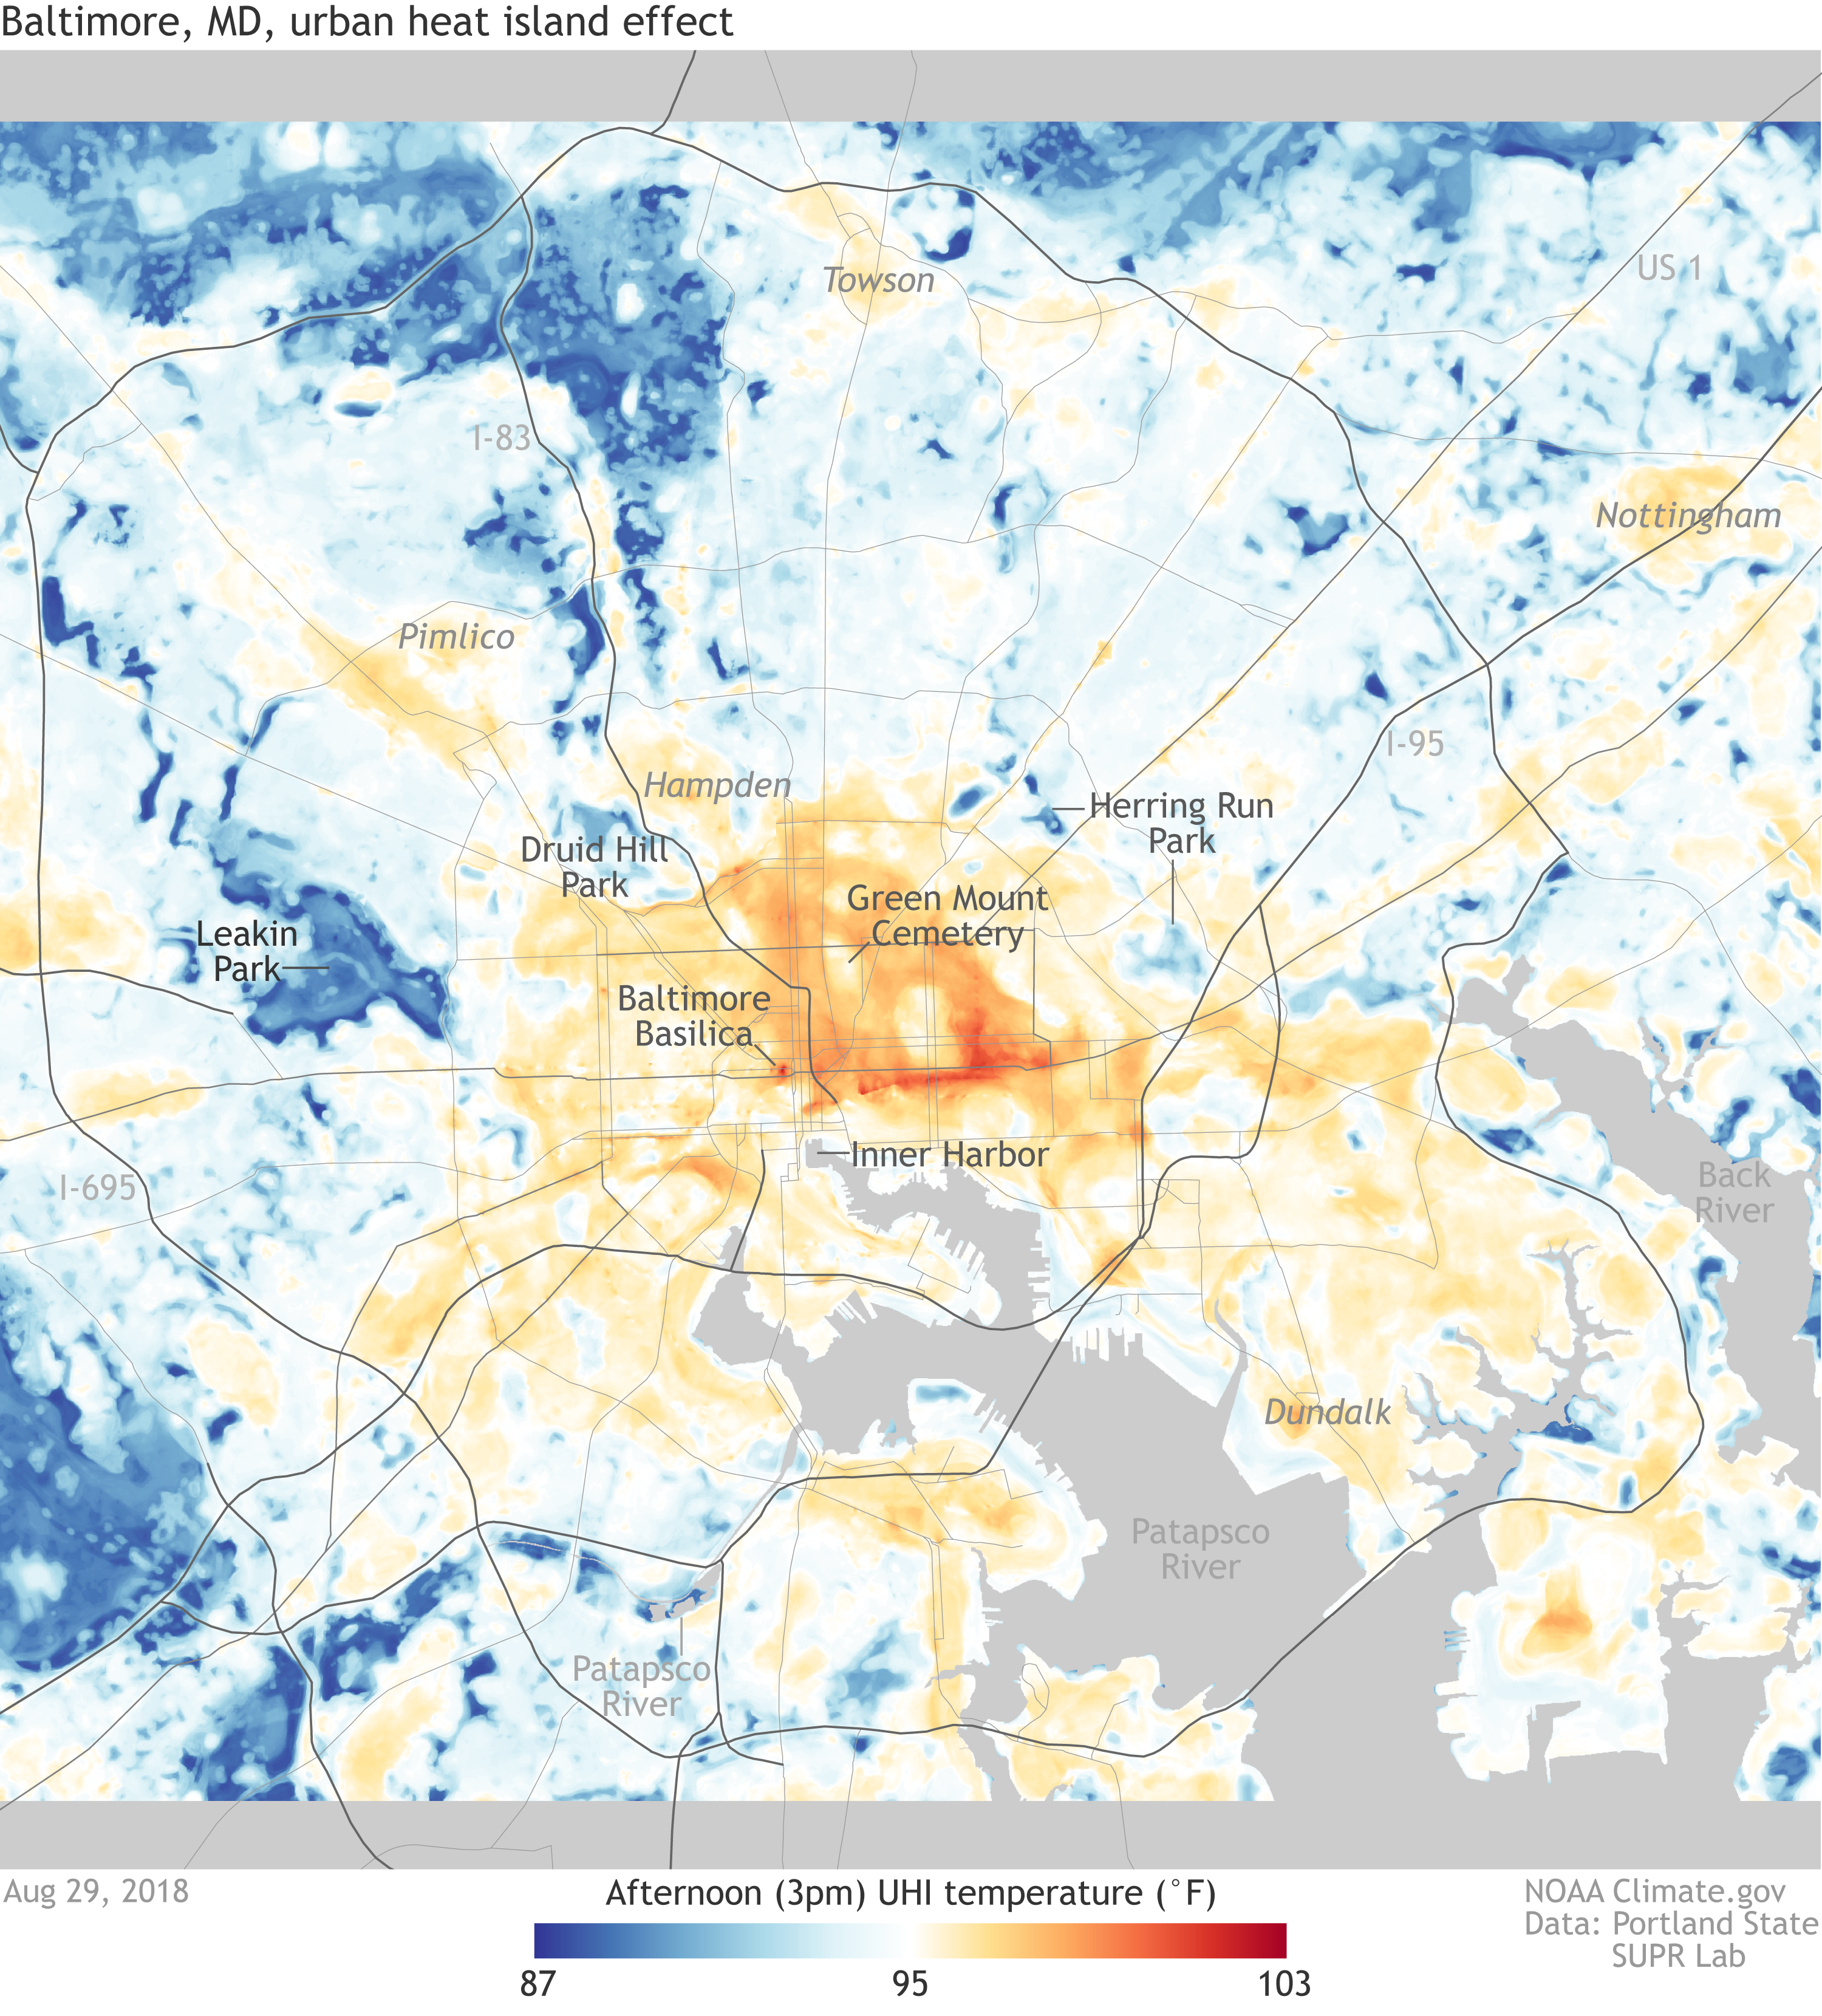
on one of the hottest days of summer, people in some Baltimore neighborhoods sweltered in temperatures of 103 degrees F, some 17 degrees higher than the coolest parts of the city at the same time in the afternoon. A similar pattern took place in D.C. a day earlier when temperatures soared to 102 degrees F in several neighborhoods, while other parts of the city were 16 degrees cooler.
In support of that story, the Climate.gov team produced maps of the data and paired them with matching satellite images of each city so that readers can get a sense of how and why each city experiences such a wide range of temperatures on a hot summer day. For each city, the temperature data are colored in shades of blue (coolest half of the day's temperature range) to red (warmest half). In the satellite images, patches of woods, parks, and other vegetation are shades of green, while pavement, buildings and other developed areas are shades of white and gray. Grab and drag the sliders to compare the temperature maps (left) to the satellite views (right). Download large versions: DC | Baltimore.


At the northern edge of the DC city limits, Rock Creek Park crowns the city's cool northwest, which stretches from the park down to the Potomac River, which forms the city's border with Virginia. The hottest areas of the city on this day were in the city's northeast, between Rt. 1 and Rt. 29 (which runs north of the city into Silver Spring, MD). Silver Spring and other northern suburbs look like warm balloons tethered to the city by warm strings of roadway.
The influence of roadways on temperature patterns is clear in the Baltimore map, too. The metro area's densest development, and hottest areas, are in the center of the image, with warm areas extending southward on either side of the Patapsco River. Both inside and outside the city's Beltway, communities like Pimlico, Towson, and Nottingham stand out as warm spots, connected back to the warm urban core by narrow ribbons of warmth.


The OAR story said,
NOAA and its partners are sharing the maps and data with officials in Washington, D.C., and Baltimore who have expressed interest in using them to help plan cooling strategies and inform resiliency plans. The team is also developing a strategy by which many more urban heat island mapping campaigns can be conducted in other cities across the United States in the summer of 2019 and beyond.
Related
National Integrated Heat Health Information System at the U.S. Climate Resilience Toolkit.
Protecting People from Sweltering City Summers
With rising greenhouse gases, U.S. heat waves to become more common & longer-lasting
Influence of global warming on U.S. heat waves may be felt first in the West and Great Lakes regions