The New Climate Normals: Gardeners Expect Warmer Nights
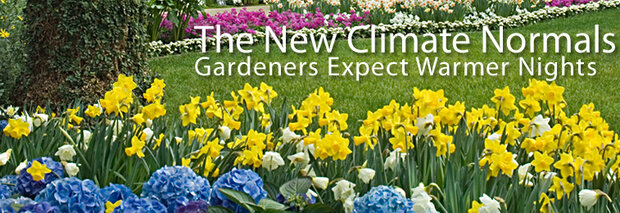
Spring blooms at Longwood Gardens. Photo by Andrea Poe, Washington Times Communities.
When several grand sugar maples at the famous Longwood Gardens in Pennsylvania succumbed to disease recently, grounds manager Shawn Kister wondered if warm winters were to blame. Some plant diseases are stopped by cold, he knew, and others are encouraged by longer warm periods. Sugar maples like the cold, and Longwood is already at the southern edge of their historical range.
A few hundred miles south, Charlotte-based TV meteorologist John Ahrens noticed that area rainfall had remained lower than normal for several years. The farmers and landscapers around Charlotte were compensating with more irrigation, but those systems are expensive. What was going on? Was this going to be the new normal?
Defining normal
Gardeners, meteorologists, businesses, weather junkies and others will get answers to some of these questions in July, when NOAA's National Climatic Data Center (NCDC) releases the latest version of an official weather product called the U.S. Climate Normals.
Updated each decade, the U.S. Climate Normals are 30-year averages of many pieces of weather information collected from thousands of weather stations nationwide. Each time they are updated, an old decade is dropped, and a new one added. Starting in July, when you hear that a day was hotter, or colder, or rainier than normal, that "normal" will be a little different from what it was in the past.
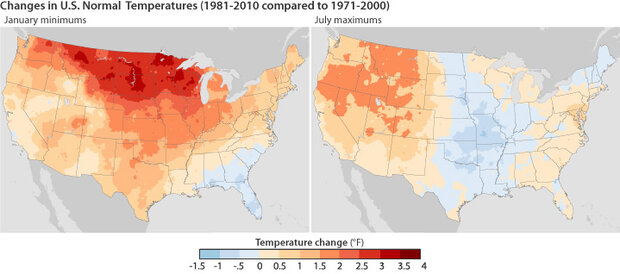
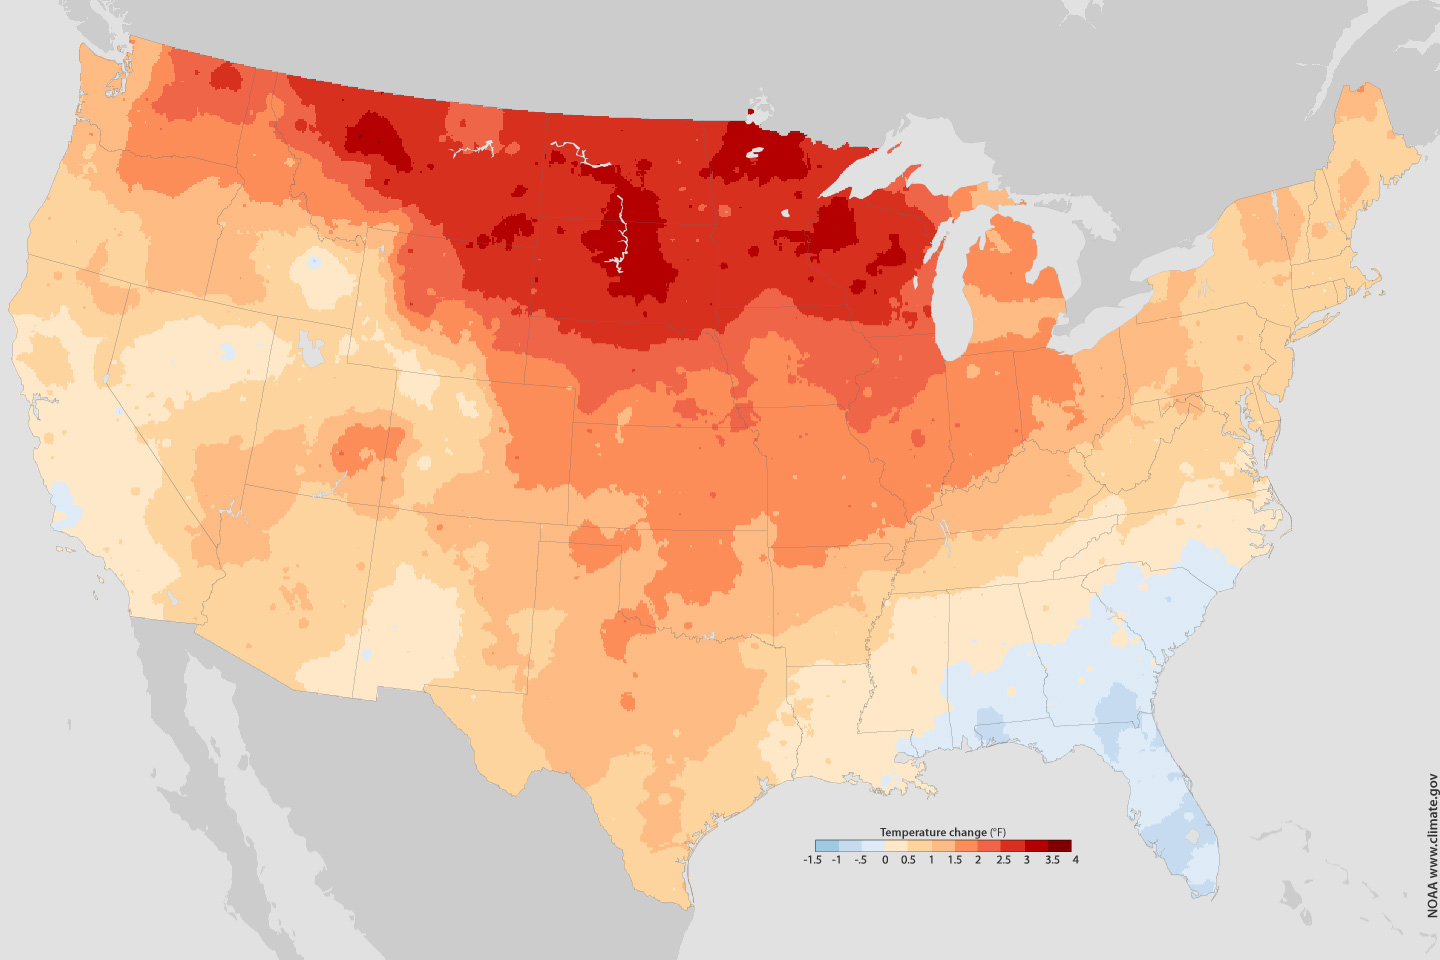
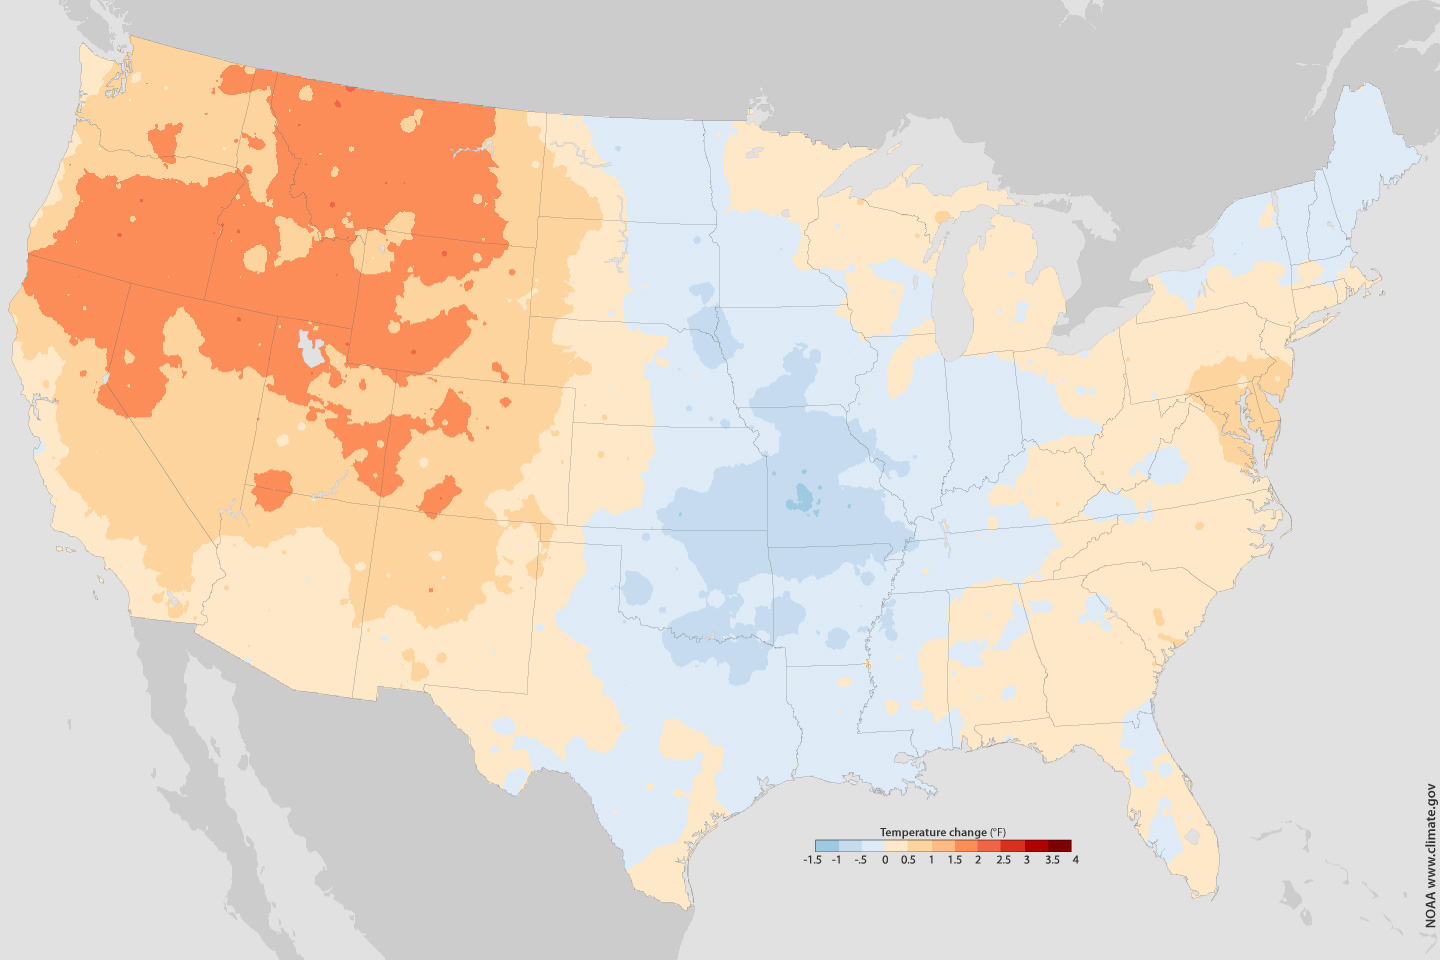
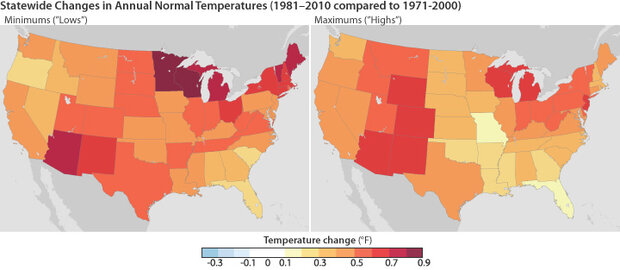
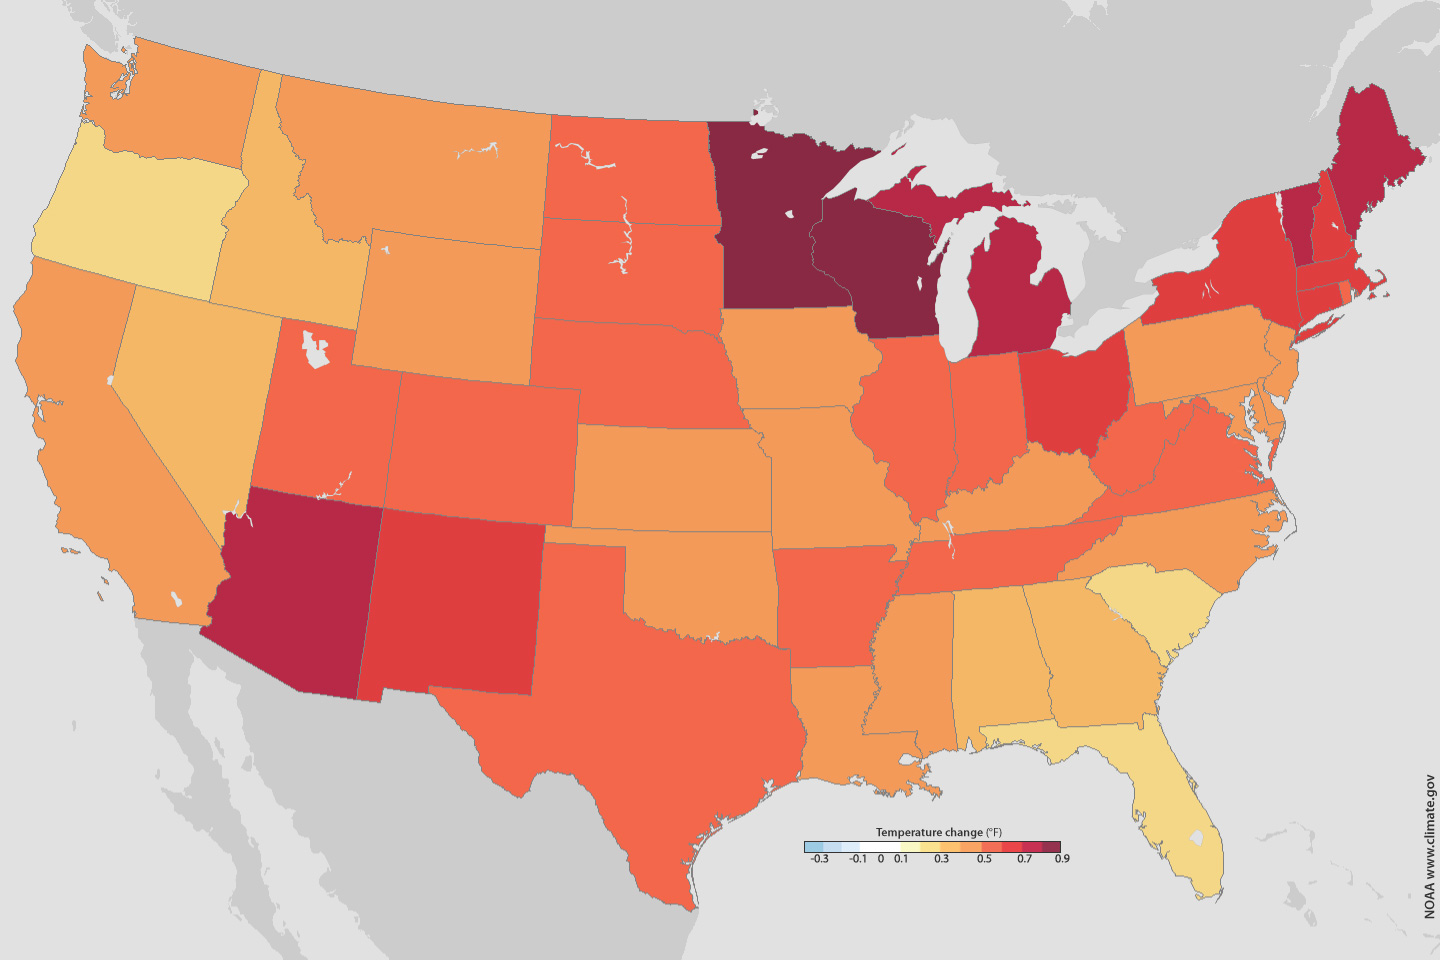
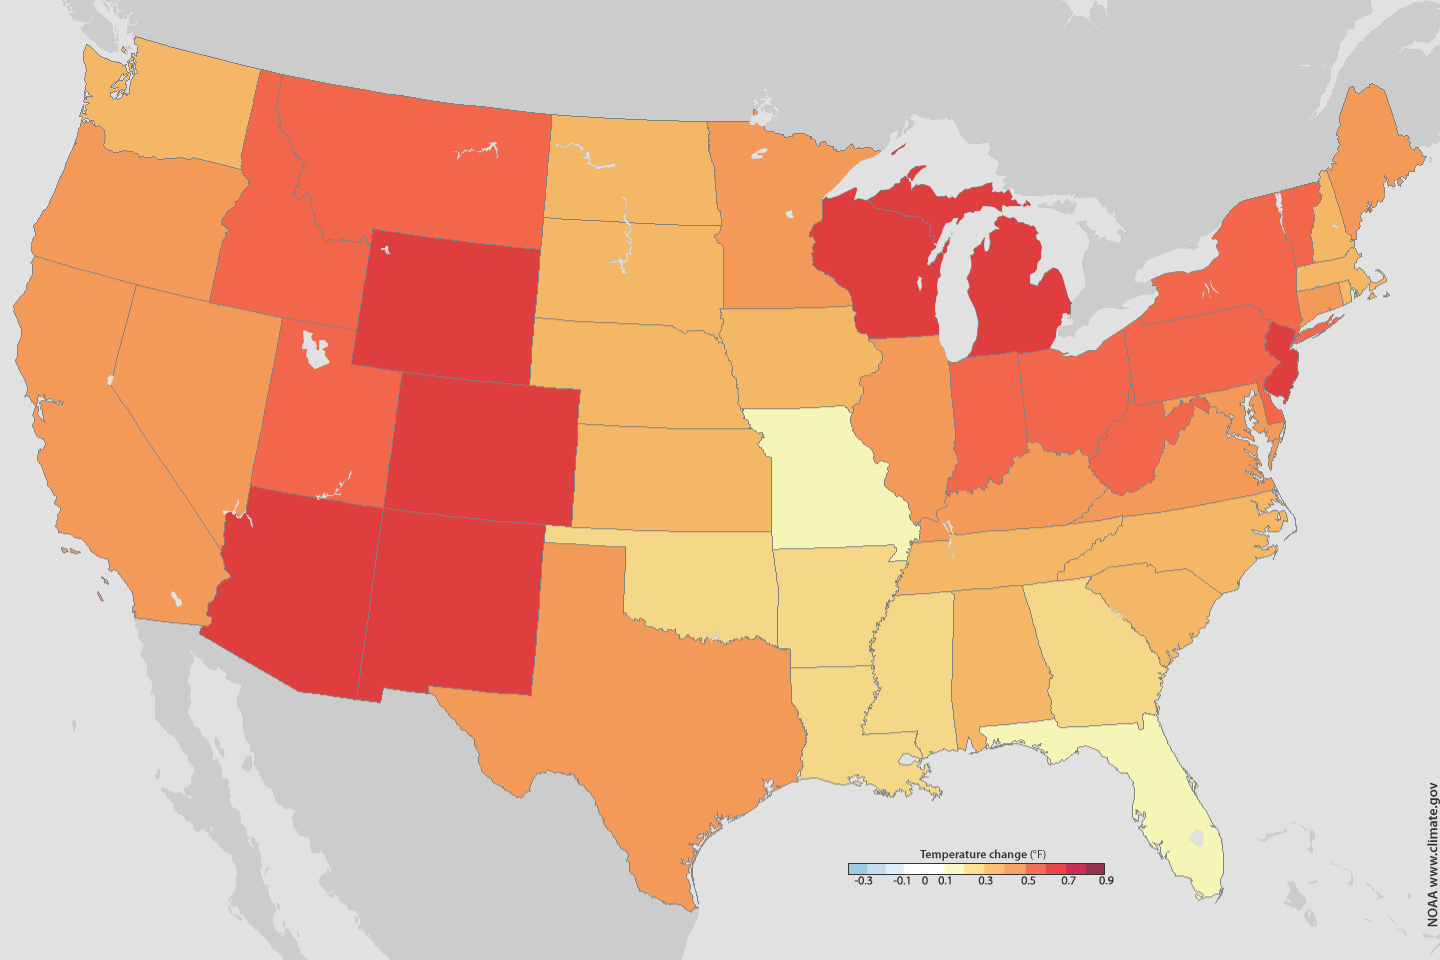
Across much of the country, overnight low temperatures in January are as much as several degrees warmer in the 1981–2010 Normals than they were in the 1971-2000 version (left). Meanwhile, the average maximum temperatures in July are actually cooler across some parts of the country (right). large maps: January | July
This time around, the 30-year window for the U.S. Climate Normals is 1981-2010: the decade 1971-1980 was dropped, and 2001-2010 was added. Since the '70s were an unusually cool decade, while 2001-2010 was the warmest ever recorded, it is not surprising that the average temperature rose for most locations. For the United States as a whole, it was not daytime highs (maximum temperatures) but overnight lows (minimum temperatures) that rose the most compared with the 1970s.
Many areas of the country—parts of the Great Plains, the Mississippi Valley, and the Northeast—actually had cooler July maximum average temperatures in the 2001-2010 time period compared to 30 years earlier; summer picnics in Missouri may have been less sweltering. At night, though, except for the southeasternmost part of the country, minimum temperatures in January were warmer. When temperatures were averaged for the entire year, every state came out warmer overall.
Assembling the Normals
The observations that go into the U.S. Climate Normals come from the National Weather Service's network of Cooperative Observer Program (COOP) stations, numbering in the thousands; a smaller network of "first order" stations maintained by professionals in the National Weather Service or Federal Aviation Administration, numbering in the hundreds; and more than one hundred NOAA Climate Reference Network stations established in the past decade.
Rainfall data are collected from than 8,000 stations, while temperature comes from about 6,000 stations. Some of the data are collected and reported automatically by instruments, while most of the measurements are collected manually each day by volunteers. Once a decade, a team at NOAA's National Climatic Data Center calculates the U.S. Climate Normals from these millions of bits of raw data.
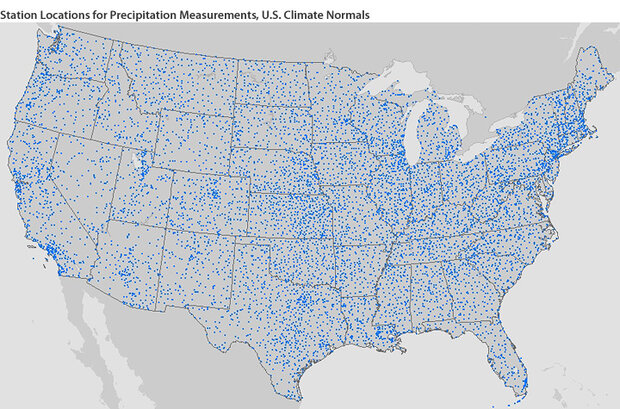
The U.S. Climate Normals draw on precipitation measurements from several thousand stations located across the country. NOAA map by Ned Gardiner, based on data from the National Climatic Data Center.
NOAA scientist Anthony Arguez is the U.S. Climate Normals project manager. "Our job," he says, "is to take the data values as collected by the National Weather Service, apply robust quality control and standardization to improve the fidelity in our products, and use sophisticated statistical techniques that result in high-quality normals of temperature, precipitation, snowfall, and derived quantities such as heating and cooling degree days."
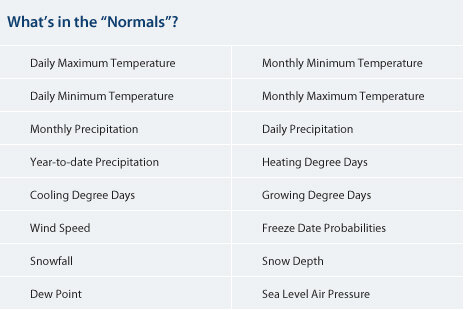
The chart shows a range of variables—temperature, precipitation, wind speed, snowfall, and more—that factor into U.S. climate normals.
Based on feedback from user groups such as power companies, National Climatic Data Center scientists have added some new information into the U.S. Climate Normals product suite, such as hourly temperatures and month- or year-to-date precipitation. The data can be accessed by anyone who wants to use them, such as television stations, water managers, insurance and energy companies, meteorologists, or emergency planners.
The general methods for calculating climate normals were established back in the 1930s by the World Meteorological Organization (WMO), and they are still followed by the United States and many nations all over the world. The consistency means that the U.S. Climate Normals are part of a reliable, long-term data record that can be used for studying natural climate patterns and climate change. The information also helps people understand what conditions they can expect wherever they may live.
Plants (and Pests) Respond to Warmer Night
Longwood Garden's Shawn Kister is not the only public garden expert wondering about a shifting climate. "Longer periods of warm weather affect plants in many ways," says Mac Franklin, the head gardener of the North Carolina Arboretum, who in April is already sporting a farmer's tan. "It can mean less water in the soil," he explains, "and then the rain we do get can't seep into the ground as easily. Longer warm periods can lengthen the pest season and allow for more generations of pests," such as aphids.
Pests are also able to thrive and spread in forests and other natural landscapes at least in part because of warmer nights. Both the native pine bark beetle, which has ravaged forests from Colorado to Alaska, and the introduced wooly adelgid, which has been sucking the life out of hemlocks in the East, may be benefiting from warmer nights, especially in winter.
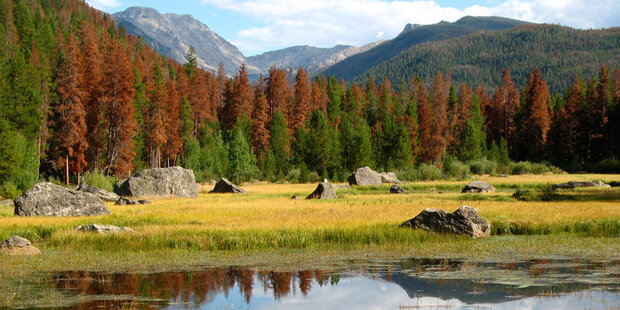
Photo of standing dead trees—pine beetle damage—in a patch of forest in the mountains near Granby, Colorado. Warmer winters are allowing the destructive insect to thrive. The pine beetle has infested 1.5 million acres of lodgepole pine in Colorado.
With warmer nights, fire season is longer. Pollination patterns may be changing. A study sponsored by Longwood Gardens showed that flowering plants have been blooming an average of one day earlier each decade. Warmer nights and later onset of freezing days also means that plants can generally survive farther north than they used to.
Changes in U.S. climate-related planting zones between the 1971-2000 Normals and the 1981-2010 Normals. Many places' coldest temperatures of the year grew warmer between the two periods, leading to a shift in plant hardiness zones. NOAA Climate.gov, based on data from NCEI. Explore an interactive map.
North Carolina Arboretum Director George Briggs offers this advice to gardeners facing a shifting climate: "If they are climate-literate they can put risk management into their decision making, make their design specifications more conservative."
"Public gardens have to balance costs, benefits and risk," says Briggs. "It's a more complex decision matrix with these shifts. Will gardens have to beef up their sewer systems to account for heavier rain events? How much irrigation to put in? Where once you needed just enough to establish the landscape, now there may be a continuing need for water, or maybe you put in more conservative plants that are more water-efficient."
Looking to the future
To help garden visitors make sense of all these changes, the American Public Gardens Association is creating a cell phone tour about climate. At Longwood Gardens, the tour will begin in the managed meadow close to a still-surviving grand old sugar maple.
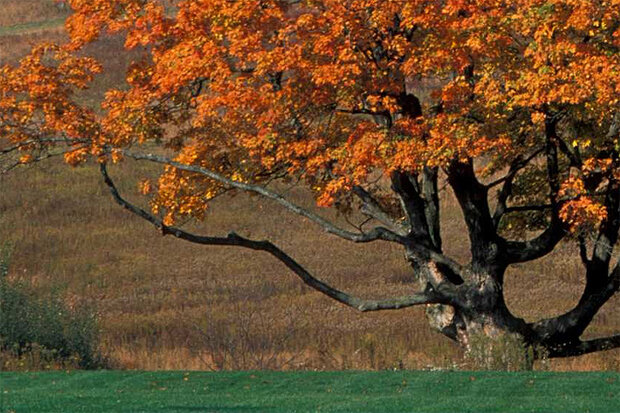
A surviving sugar maple overlooks a managed meadow at Longwood Gardens in Pennsylvania. The tree is the first stop on a cell phone tour of the garden that explains the potential impacts of climate change on plants.
"There is telling evidence that climate change is affecting plant life around the world and here at Longwood," says Paul Redman, Longwood's Director. "Sharing the important work of NOAA with our staff, guests, and community is integral to our mission and continues Longwood Gardens' commitment to environmental stewardship."
As for the U.S. Climate Normals, the team at the National Climatic Data Center in Asheville will continue to release additional products over the coming months. These will include agricultural normals such as Frost/Freeze Dates, and population-weighted normals such as Heating and Cooling Degree Days.
In the meantime, new data are being collected every day, at thousands of stations nationwide, that will eventually become part of the 1991-2020 U.S. Climate Normals, due for release in another ten years.
Jennifer Freeman is a science writer with the American Meteorological Society. She wrote this article while on assignment to NOAA's National Climatic Data Center.
Links
Slideshow: Plants and Climate Change Impact of Climate Change on Agriculture
Past Three Decades Warmest on Record 2010 Ties 2005 as Warmest Year on Record