November 2020: Above-average temperatures likely for much of the country
How will Autumn 2020 end? Will it buck the ongoing warmer-than-average trend seen so often this year? Will La Niña’s influence from the Pacific play a role in what sort of temperature and precipitation patterns we see? So many questions. But here is, hopefully, an answer of sorts. According to the November 2020 outlook from NOAA’s Climate Prediction Center, much of the country is likely to observe a warmer-than-average month, while the southern tier of the U.S. is also likely to see drier-than-average conditions.
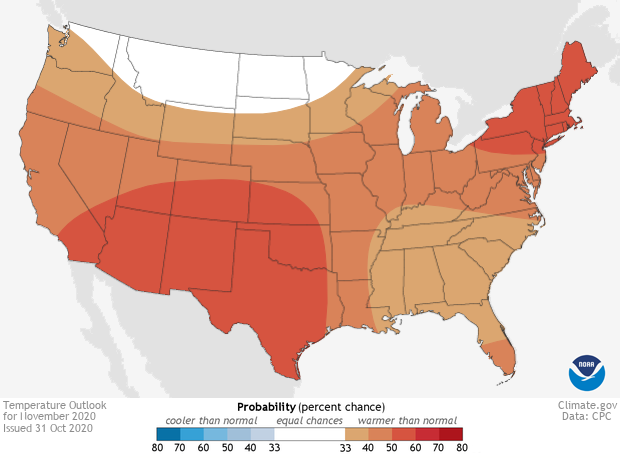
This map shows the probability (percent chance) that November 2020 temperature at any location will be in the upper, middle, or lower third of the climatological record (1981-2020). Red colors indicate a warmer-than-average month is most likely, while blues indicate a cooler-than-average month is most likely. Darker colors mean higher chances; not more extreme conditions. Climate.gov image from Data Snapshots, using data from NOAA's Climate Prediction Center.
The monthly outlooks come with our monthly reminder that these maps are not a forecast for the absolute temperature or precipitation amounts in November. Instead, they are the probability (percent change) that November temperatures or precipitation will be in the upper, middle, or lower third of the climatological record (1981-2010) for November. We refer to these categories as “well above” and “well below” average. The colors (red or blue for temperatures, brown or teal for precipitation) indicate which outcome is most likely. Darker colors reflect higher chances of a given outcome; not more extreme conditions. Want to dig deeper on the math? Head to the end of this post.
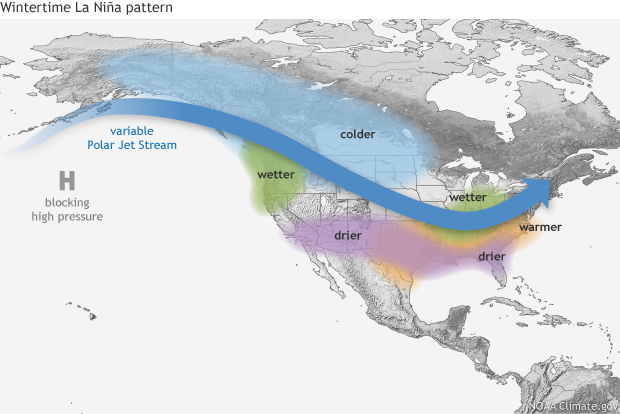
Typical impacts of La Niña on U.S. winter temperature and precipitation. Such impacts have been associated with past episodes, but all impacts aren't seen with every episode. NOAA Climate.gov drawing by Fiona Martin.
Stop me if you’ve heard this before. Above-average temperatures likely for much of the country.
For November 2020, scientists at the Climate Prediction Center favor a hotter-than-average month for most of the country. The best odds across the contiguous United States are located across the Southwest, which is already mired in drought, and the Northeast. In fact, the only area with odds not tilted towards warmer than average is across the Northern Rockies and Northern Plains where the chances for each of the three possible climate outcomes (above, below or near-average) are equal.
One factor influential in this outlook is the ongoing La Niña in the tropical Pacific. La Niñas tend to lead to above-average temperatures across the southern tier of the U.S. and cooler-than-average temperatures across the northern tier. This pattern holds true for southern areas in the November outlook. However, due to a decadal warming trend across the North, the typical La Niña pattern doesn’t prevail across northern areas. Considering these mixed signals, the end result is an equal chance forecast.
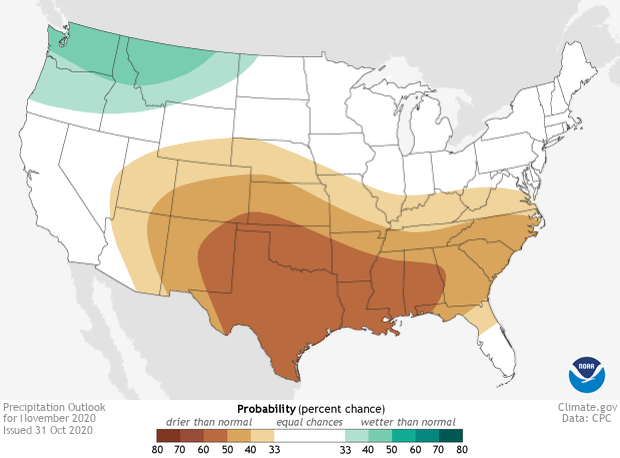
This map shows the probability (percent chance) that November 2020 precipitation at any location will be in the upper, middle, or lower third of the climatological record (1981-2020). Teal colors indicate a wetter-than-average month is most likely, while browns indicate a drier-than-average month is most likely. Darker colors mean higher chances; not more extreme conditions. Climate.gov image from Data Snapshots, using data from NOAA's Climate Prediction Center.
Below-average precipitation likely across the South
The precipitation outlook pattern for November 2020 looks like one that you’d expect during a La Niña, with some important caveats. There is a large area across the southern United States favored to observe below-average precipitation during the next month. The highest chance (50-60%) is located over a large swath of the country, stretching from New Mexico, Texas, and Oklahoma to the Gulf Coast states. The one area across the contiguous United States favored to see an above-average amount of precipitation is the Pacific Northwest stretching east across Montana.
In contrast to the normal La Niña pattern, though, the extent of the below-average precipitation outlook does not extend fully across the Southwest into Southern California. November is still a relatively dry time of the year for these locations, and additional forecast uncertainty makes for an outlook calling for equal chance of all three outcomes.
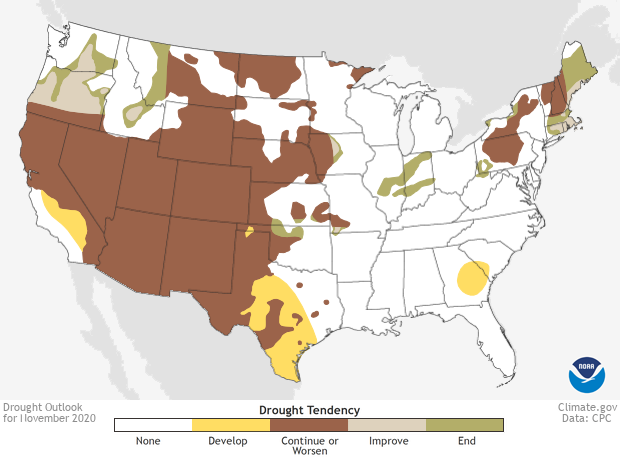
This map shows experts' assessment of how drought conditions are likely to change throughout November 2020. Dark brown areas, such as those covering much of the West, show where drought conditions are likely to persist or worsen, while tan areas show where drought is likely to improve, but not end. Gold shows areas where drought is likely to emerge, while green shows where drought is forecast to end. NOAA Climate.gov Data Snapshots image, based on data from NOAA Climate Prediction Center.
Drought forecast to expand across Texas and California
The forecast for a tilt in the odds towards a warmer-than-average and drier-than-average November across Texas has had the added effect of increasing the chance of drought development across much of central Texas. Drought is also expected to develop during a dry November across interior portions of central and southern California. Meanwhile, the broad expansive drought across the western United States is expected to persist through November. The one main exception is across Washington and Oregon where the increased chances for heavier-than-normal precipitation are predicted to aid in improving and maybe even removing drought.
The current state of drought across the western United States coincides with many areas seeing multiple record-breaking wildfires dating back to the summer. Wildfires in Colorado and California have re-written the state record-books. In Colorado, the wildfires are taking place on top of land currently in extreme (D3) to exceptional (D4) drought, the two most intense categories of drought. Areas of exceptional (D4) drought can also be found across the Four Corners region in Utah, Arizona, and New Mexico, and stretching into western Texas. The November climate outlook doesn’t appear to be bringing any good news on that front, as warmer and drier-than-average conditions are favored.
To see the entire discussion of the monthly climate outlook from the Climate Prediction Center, head to their website. And check back later this month for a recap on what happened climate-wise across the US and globe in October.