2021 Arctic Report Card: image highlights
NOAA’s 2021 Arctic Report Card documents the numerous ways that climate change continues to fundamentally alter this once reliably frozen region, as increasing heat and the loss of snow and ice drive its transformation into a warmer, less frozen, and more uncertain future.
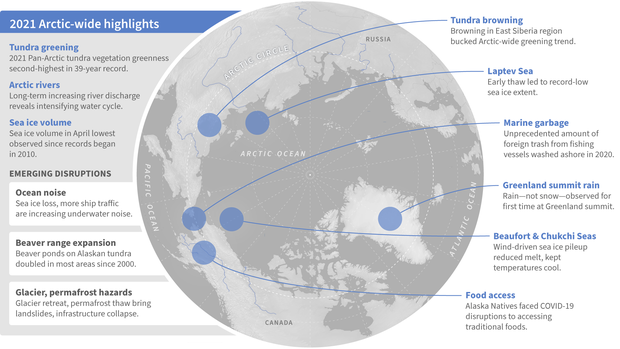
Highlights of NOAA's 2021 Arctic Report document the dramatic change underway in the region and how it is disrupting ecosystems and communities in the polar North. NOAA Climate.gov image.
"This year’s Arctic Report Card continues to show how the impacts of human-caused climate change are propelling the Arctic region into a dramatically different state than it was in just a few decades ago,” said NOAA Administrator Rick Spinrad, Ph.D. “The trends are alarming and undeniable. We face a decisive moment. We must take action to confront the climate crisis.”
Compiled by 111 scientists from 12 nations, the 2021 Arctic Report Card was released today during a virtual press conference hosted by the American Geophysical Union during its fall meeting in New Orleans. You can read the full press release, scroll down for a collection of images and stories highlighting some of this year's key findings, or go directly to the Arctic Report Card home page.

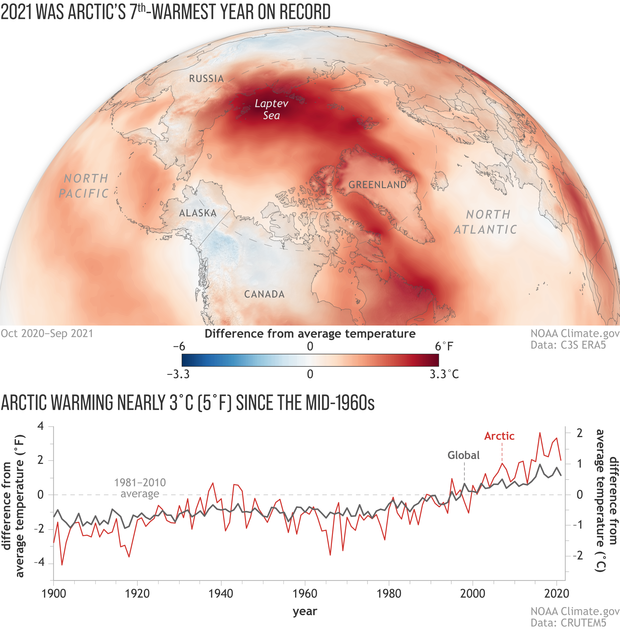
(map) Annual temperature (October 1, 2020–September 30, 2021) across the Arctic compared to the 1981-2020 average. Deep reds across the Eurasian Arctic over the Laptev Sea show the imprint of a record-warm fall. NOAA Climate.gov map, based on ERA5 Reanalysis data from the Copernicus Climate Change website. (graph) Since 2000, Arctic warming (red line) has been more than twice the global average (black line). NOAA Climate.gov image, adapted from Figure 1, in the Surface Air Temperature essay in the 2021 Arctic Report Card, based on CRUTEM5 data.
Read more
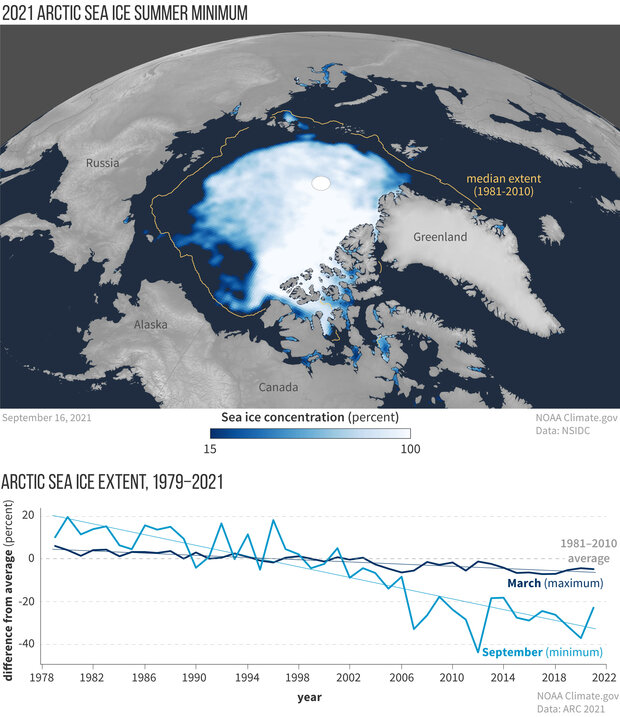
(top) Sea ice concentration on September 16, 2021, the day of the annual minimum extent. The yellow line shows the 1981–2010 median extent: half of years were smaller and half were larger. (bottom) Yearly Arctic sea ice extent at summer minimum in September and winter maximum in March from 1979–2021. The summer minimum ice extent is decreasing more rapidly than the winter maximum. NOAA Climate.gov map, based on data from the National Snow and Ice Data. Graph adapted from 2021 Arctic Report Card.
Read more
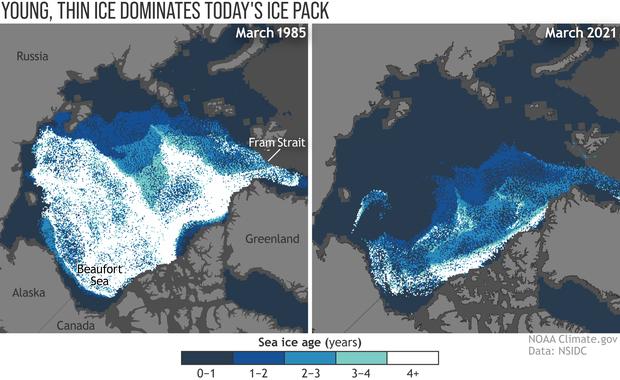
Routine observations of Arctic sea ice thickness only began about a decade ago, experts use the age of the ice pack—which has been observed since the 1980s—as a proxy for ice thickness. In mid-March 1985 (left), the winter maximum ice pack was dominated by ice at least 4 years old (white). In 2021 (right), only a small strip of very old ice remained tucked up against the islands of the Canadian Arctic. More than half of the winter ice pack was less than a year old (dark blue). NOAA Climate.gov image, based on data from the National Snow and Ice Data Center.
Read more
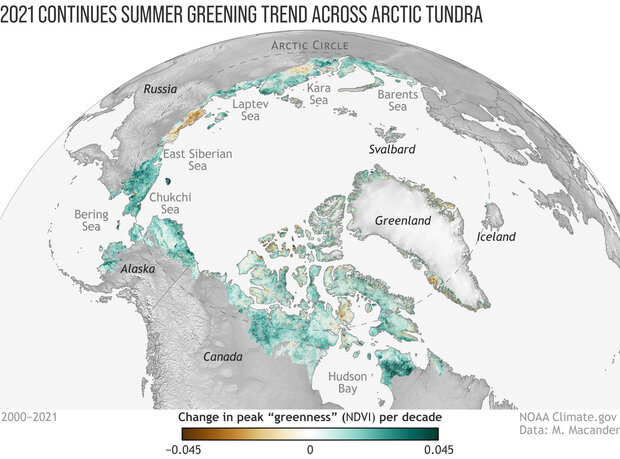
Changes in tundra greenness between 2000 and 2021, based on satellite observations. Arctic-wide, most areas are greening—a sign of increasing plant productivity in a warmer climate. A few areas are browning, which points to competing local influences, including extreme events like fires. NOAA Climate.gov image, based on data from Matt Macander.
Read more
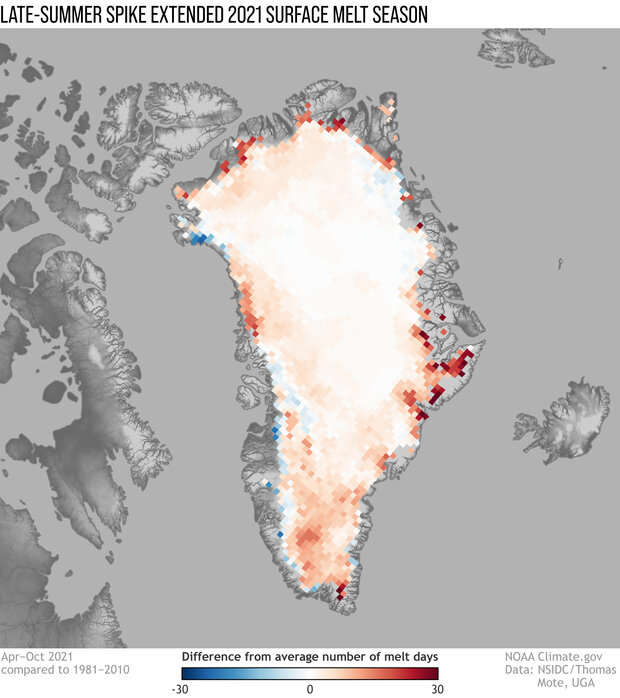
Map of Greenland showing where the number of days on which satellites observed surface melting from April–October was above (red) or below (blue) the 1981-2010 average. The number of melt days was above average almost everywhere, including deep in the high-elevation interior of the ice sheet.
Read more