Tools & Interactives
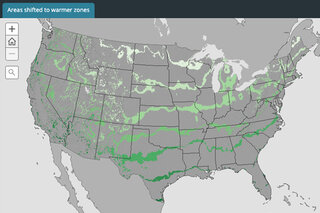
Interactive map showing the average annual coldest winter temperatures across the contiguous U.S. divided into 10-degree "planting zone" bins for 1971-2000, 1981-2010, and the shift between the two.
View this tool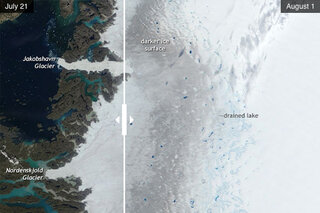
Compare before and after images of the Greenland ice sheet. The ice sheet after the heatwave is much darker and several bright blue pools of meltwater appear to have drained while new ones have formed.
View this tool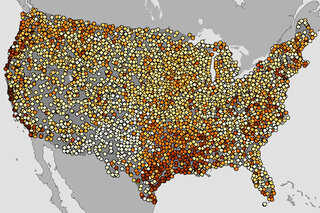
Map containing two layers: one showing the hottest maximum temperature recorded at a station during the summer, and the other showing the week when that station's record was set.
View this tool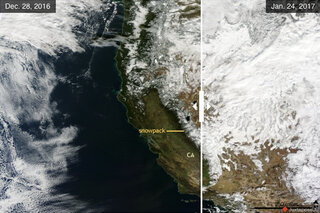
Grab and drag the slider to compare the before and after images of an atmospheric river event in California in January 2017 that greatly increased mountain snowpack.
View this tool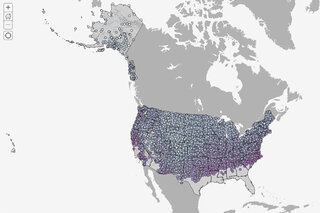
This map shows the earliest first day of snow recorded at thousands of locations in the U.S., based on Global Historical Climatology Network station data from NOAA NCEI.
View this tool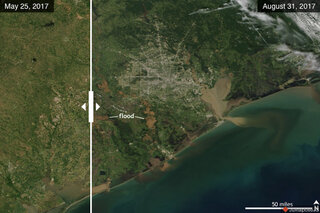
Grab and drag the slider to compare the before and after images of heavy rains and floods in Houston, Texas after Hurricane Harvey in August 2017.
View this tool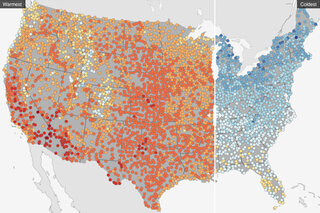
Grab and drag the slider to compare the warmest and coldest first days of summer recorded at thousands of U.S. locations.
View this tool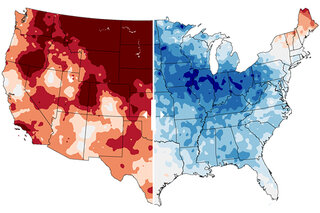
Compare change in February average temperature between 1895-2016 to change in February average temperature between 1987-2016.
View this tool