June 2023 ENSO update: El Niño is here
El Niño conditions have developed, as the atmospheric response to the warmer-than-average tropical Pacific sea surface kicked in over the past month. We expect El Niño to continue into the winter, and the odds of it becoming a strong event at its peak are pretty good, at 56%. Chances of at least a moderate event are about 84%.
El Niño—the warm phase of the El Niño-La Niña climate pattern—changes global atmospheric circulation in known ways, giving us an idea of potential upcoming weather and climate patterns. A stronger El Niño means global temperature, rain, and other patterns are more likely to reflect the expected El Niño impacts. I’ll get into some of the details of those impacts later in this post.
The circus is in town
El Niño conditions are present when we have met all the criteria of our decision tree.
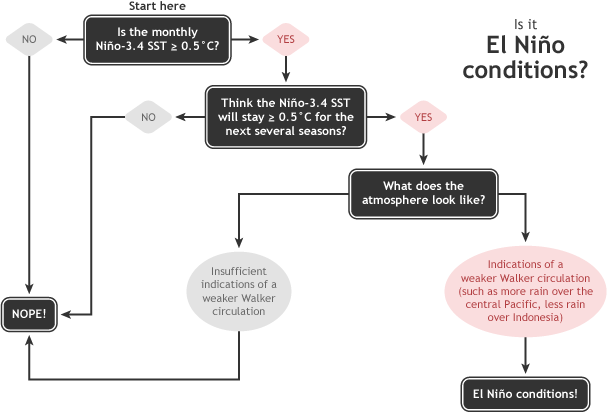
Summary of NOAA decision process in determining El Niño conditions. NOAA Climate.gov drawing by Glen Becker and Fiona Martin.
The monthly Niño-3.4 index, which tracks the temperature of the surface of the tropical Pacific ocean, was 0.5 °Celsius (0.9 ˚Fahrenheit) above the long-term average (long-term = 1991–2020), according to the OISSTv2.1 monthly dataset. 0.5 °C is the threshold for El Niño, so… check! The warm-up following our recent La Niña has been pretty remarkable. We even clocked in a 0.8°C value over the past week in the same dataset, so temperature anomalies are continuing to increase.
Animation of maps of sea surface temperatures in the Pacific Ocean compared to the long-term average over five-day periods from the end of January to early June 2023. The waters in the key monitoring region, which scientists call "the Niño-3.4 region," start out cooler than average (blue) and progressively become warmer than average (red) as La Niña ends and El Niño arrives. A higher-resolution version of this animation is available as a movie. NOAA Climate.gov, based on Coral Reef Watch maps available from NOAA View.
We anticipate that it will remain above this El Niño threshold for the next several months, based on climate model predictions and current conditions in the tropical Pacific (more on this in a minute)… check! There are the first two of our three rings criteria.
The flying trapeze
The third criteria, “indications of a weaker Walker circulation,” refers to the average atmospheric pattern over the equatorial Pacific. The average Walker circulation is characterized by rising air and storms (convection) over the very warm waters of the far western Pacific, west-to-east winds high up in the atmosphere, descending motion over the relatively cooler waters of the eastern Pacific, and the trade winds—east-to-west surface winds. These strong surface winds help to keep the warm water piled up in the western Pacific.
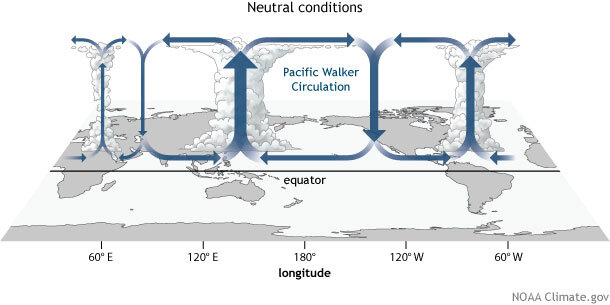
Generalized Walker Circulation (December-February) during ENSO-neutral conditions. Convection associated with rising branches of the Walker Circulation is found over the Maritime continent, northern South America, and eastern Africa. NOAA Climate.gov drawing by Fiona Martin.
El Niño’s warmer-than-average surface water alters this circulation by bringing more rainfall and convection to the central and eastern Pacific. The trade winds weaken, which allows the surface to warm further, allows warmer water to slosh back eastward, and reinforces the El Niño sea surface temperature pattern. This is the critical feedback mechanism indicative of El Niño.
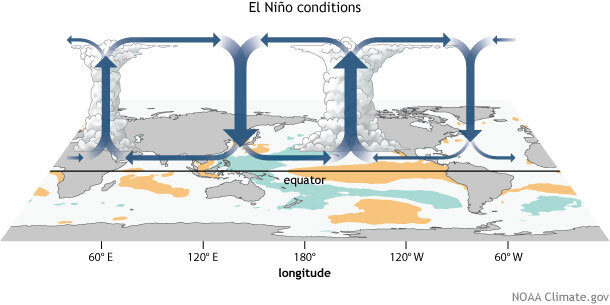
Generalized Walker Circulation (December-February) anomaly during El Niño events, overlaid on map of average sea surface temperature anomalies. Anomalous ocean warming in the central and eastern Pacific (orange) help to shift a rising branch of the Walker Circulation to east of 180°, while sinking branches shift to over the Maritime continent and northern South America. NOAA Climate.gov drawing by Fiona Martin.
Over the past month, evidence of the weakened Walker circulation appeared in the form of weaker trade winds over the western Pacific and more clouds and rain over the equatorial Pacific. Convection over Indonesia was reduced, too, another characteristic of the weaker Walker circulation.
We quantify the atmospheric component of El Niño using the Equatorial Southern Oscillation Index (EQSOI) and the Southern Oscillation Index (SOI), both of which compare the surface atmospheric pressure in the western Pacific to that in the eastern Pacific (more details on these indexes here). Both measured -1.0 standard deviations in May (meaning the indexes were lower than about two-thirds of all measurements), providing significant indication of the weaker Walker circulation and further evidence that the ocean-atmosphere system has coupled and El Niño conditions have developed.
Ringmaster
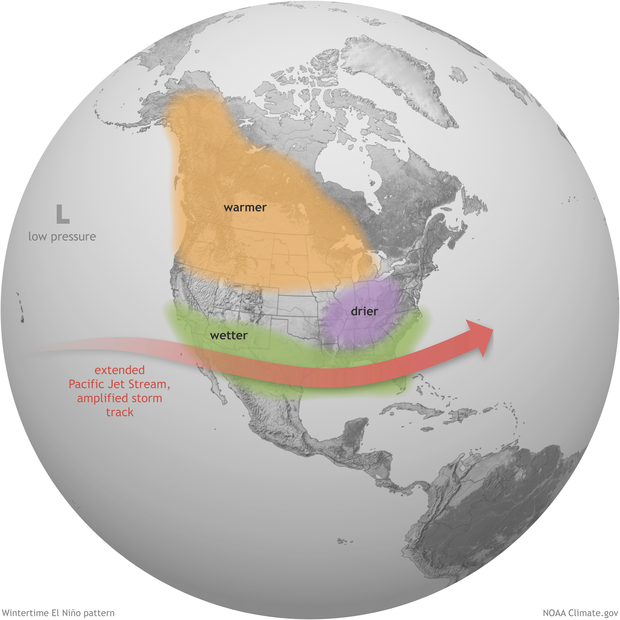
We spend so much time and energy studying and forecasting El Niño (and its counterpart, La Niña) because those changes to the atmospheric circulation have global impacts. In a one-paragraph nutshell: warm air that rises near the equator moves toward the poles high up in the atmosphere, descending again near 30 °N and 30 °S, in an overturning pattern called the Hadley circulation. The Hadley circulation is connected with the jet streams over the middle to high latitudes, which steer storms around the world and separate cold and warm air masses.
As El Niño heats the atmosphere above the central and eastern tropical Pacific, it leads to a stronger Hadley circulation and changes to the jet streams. For example, in an El Niño winter, an extended North Pacific jet stream tends to bring more storms across the southern tier of the U.S. and warmer air to the northern half of North America.
Since El Niño can usually be predicted months in advance, we can anticipate these changes and their impacts. When El Niño is stronger, meaning the sea surface temperature is much warmer than average, it has a stronger hand in changing global circulation, making the impact patterns more likely.
Of course, nature is full of surprises, and while El Niño makes certain patterns more likely, we never get exactly what we expect! For more on this high-wire act, I’ll let the titles of these two posts speak for themselves: “Not what I ordered: How El Niño is like a bad bartender,” and “No, you can’t blame it all on El Niño… but it’s still a seasonal forecaster’s best friend.”
Fire breather
Along with the atmospheric signs, the subsurface ocean is also providing confidence that El Niño will continue.
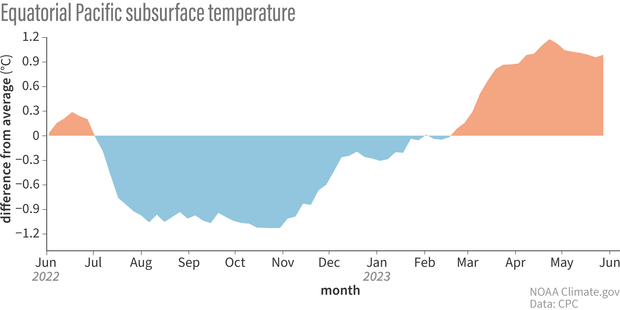
Graph showing the average temperature over the past year of the top 300 m (~1000 ft) of the Pacific Ocean, 180-100°W departure from the long-term (1991–2020) average. Graph by climate.gov from CPC data.
There is currently quite a lot of warmer-than-average water under the surface of the Pacific, as one downwelling Kelvin wave (an area of warm water that sloshes from the west to the east under the surface) has passed through and another is emerging. In fact, the May 2023 average subsurface temperature was the fourth-warmest May value in our record (1979–2023). This definitely isn’t a 100% certain indicator that a strong El Niño will develop, but it is suggestive. The top two May values were 1997 and 2015, both of which preceded strong El Niño events, but the third, 1980, did not.
Bring in the clowns
As I mentioned above, nature always has surprises in store, and predicting anything several months in advance is difficult. While El Niño conditions have developed, there’s still a small chance (4-7%) that things will fizzle out. Clearly, we think this is unlikely, but it’s not impossible. The incredible warmth of the global oceans could throw us a curveball, since we’ve not seen this before. Another potential, but also less likely, outcome is a weak El Niño, with about a 12% chance. Check the probabilities for all El Niño outcomes here and read more about forecasting El Niño here.
In coming months, I’ll keep you updated on the development of this El Niño. We’ll also have deeper dives into some El Niño impacts, including a post on El Niño’s interaction with global temperature coming up in a couple of weeks. As Nat discussed last month, global temperatures are running way above average, and that has only continued recently. Thanks for spending your time under the big top with us!
Comments
Thank you
Thank you for an informative post, as well as the amusing circus analogy. All the factors that go into this analysis are quite remarkable; I appreciate being made aware of them.
Abnormally Warm Atlantic SSTs Affecting the Walker Circulation
First, thanks for all the ENSO Blogs, which are a significant source of scientific information for people worldwide. I really enjoy the thought process and the discussions on every post.
Could you please comment on the influence of the abnormally warm Atlantic SSTs affecting the Walker Circulation under El Niño conditions? In the last few days, the Atlantic Main Development Region (MDR) for hurricanes has reached record high temperatures (higher than in 2005), and NOAA CPC is predicting near-normal 2023 Atlantic hurricane season. Under moderate or strong "El Nino" conditions, the hurricane season "should be" mild.
And finally, how do you think that the warm Atlantic SSTs and their influence on the atmospheric circulation will affect the precipitation patterns in South America under "El Niño" conditions?
Details on the current…
Details on the current hurricane outlook are provided here: https://www.cpc.ncep.noaa.gov/products/outlooks/hurricane.shtml
There may be more local sources for this info, but in the absence of it, I recommend checking out the NMME output for S. America: https://www.cpc.ncep.noaa.gov/products/NMME/seasanom.shtml
Waiting for El Nino
Fascinating!
El Niño
I live in the PNW and quite frankly we hate El Niño. Especially US Skiers. But this article was filled with excellent information. And at least I know what to generally expect.
ENSO
Will La niña return in 2024? After super el niños 72-73 , 82-83, 97-98 and 15-16 , there was 2 year (or 3 year) la niña
Pay attention for:
https://www.ecmwf.int/en/about/media-centre/news/2023/forecasts-show-gr…
Ecmwf model 13 months forward
https://climateimpactcompany.com/may-2023-enso-outlook-enso-forecast-tr… Climate impact company , same thing
https://icar.nuist.edu.cn/qhcp/list.htm. Earlier the year, this model showed el niño till early 2025, but.....
Same thing
https://www.cpc.ncep.noaa.gov/products/CFSv2/imagesInd3/TEQMon.gif
Cfs model, subsurface pacific equatorial (anomaly) 13 Jun 2023
https://www.cpc.ncep.noaa.gov/products/people/wwang/cfsv2_fcst_history/…
Cfs model, subsurface pacific equatorial (anomaly) 20 jun 2015
After super el niño 2023-24 , we will be a la niña 24-25 and 25-26 . It is possible? Probably this el niño end in July 2024.
Certainly if we have a…
Certainly if we have a stronger El Nino, it may favor La Nina the following winter! In our historical record La Nina follows El Nino about 50% of the time.
Influence of El Niño for South Pacific Islands?
Wondering how the El Niño system potentially influences weather and sea conditions in South Pacific Islands for Sept-October 2023 transpacific cruising season. Will Ei Niño effect be strong enough by early Fall for increased cyclones and typhoons over tropical “paradise?” Bad timing for a South Pacific cruise?? 🚢 🏝️
Suggest looking at our NMME…
Suggest looking at our NMME model output that is here:
https://www.cpc.ncep.noaa.gov/products/NMME/seasanom.shtml
Sept-Nov is lead-3 currently:
https://www.cpc.ncep.noaa.gov/products/NMME/current/prate_Seas3.html
Thank you
Well done and nicely written.
Great information!
Thorough, thoughtful, helpful and well explained. Nice work!
Unfolding of ENSO patterns the last 20 years
Hi there, enjoyed this piece tremendously! Interest in climate has grown for people the world over the last few years, and ENSO blog has become an excellent resource for scientists, researchers and the global public. Kudos, keep up the good work!
Anyway, seeing the last few decades of ENSO trends, it seems one may assume El Niños are usually quick, and followed by La Niña events that are usually drawn out over a few years, with neutral-ish conditions associated.
Yet, the current triple-dip La Niña-into-El Niño set-up comes with atypical SST warmth in the North Atlantic, usually associated with La Niña years... Indeed, this odd SST anomaly, looks like conditions associated with active hurricane seasons(?), which is contrary to the idea El Niño years are 'hurricane-lite'?
ENSO phases are widely held to be distinct, reliable weather-maker indicators for rain, drought, cyclone & hurricane probability across various geographies. Is it possible this current La Niña is throwing the old wisdom 'out the window', so to speak? The data is surprising!
Really well phrased here…
Really well phrased here... I'm in agreement with you that this is pretty unusual. I personally do not quite understand why we're seeing this degree of warmth just as an El Nino is taking off (and not after it maximizes, which is the expectation). By the way, it's my experience that above-average tropical Atlantic SSTs tends to put a damper on El Nino development, so again, this combination is odd. Time will tell with this El Nino...
Thanks!
Just came across this blog. Love it! Never Stop Blogging!!
El Niño
El Niño is a problem in 2003 62.36” of rain fell 15 years later in 2018 64.11” of rain fell that’s too much rain
Eastern Tropical Pacific
Many thanks for the informative, data-driven analysis. We're watching very carefully from the Galapagos islands, where previous El Niño conditions have had a dramatic impact on marine mammals, seabirds, marine iguanas and other iconic wildlife dependent on ocean productivity.
Cold and wet on Maine Coast
It has been cold and wet for weeks on Maine coast. Anything to do with STWE?
Hi Christine, My acronym…
Hi Christine,
My acronym game is pretty bad. What do you mean by STWE?
How does the el nino of 1998…
How does the el nino of 1998 compare to this el nino stronger or weaker?
Well this El Nino just…
Well this El Nino just started and is a weak one. By this time in 1997, El nino was likely already a bit stronger.
But 1) no two El Ninos are the same and 2) El Ninos peak in strength in winter so comparing their strengths now is not that illustrative. The most recent ENSO outlook has a 56% chance of this El Nino becoming a strong event. And we will have to continue to monitor it as it develops to see if that comes to fruition.
Weather and El Ninio phase.......
HOW IS FALL OF 2023 GOING TO BE? & HOW WILL IT AFFECT US HERE IN NEW JERSEY? SINCE ITS BEEN QUITE UNUSUALLY COOL THIS YEAR?
You can find NOAA's long…
You can find NOAA's long-range predictions here: https://www.cpc.ncep.noaa.gov/products/predictions/long_range/
Water temp in Northern California
Based on local weather and surf reports, the water along the Northern California coast seems to be getting colder. Last I heard it was 50 degrees F. How does that fit in to the predictions. Any idea why it's getting colder?
Thank you for the remarkable…
Thank you for the remarkable work you do.
El Nino
as a forecaster here in Ca, there have been strong El Nino events in the past and the west coast was below normal the entire season. other times La Nino like this last winter gave Ca one of the wettest seasons on record. i think that the evidence points to warmer conditions but it all depends on where the ridge sets up off the west coast that determines rainfall potential .this last season a shift of the offshore ridge by 200 miles would have made all the difference in our rainfall. we really got lucky this last year. this next year if records hold true we will have dry year despite all the talk of super El Nino. we will just have to wait and see
Biggest snow in 70 years
California here, 1981 82 and 83 were back to back big winters. I’m wondering if we’re going to have another similar pattern. It was called the Pineapple Express back then. I’m in the pool as I write this 109 degrees. We’ll be snow skiing Tuesday the 4th in north Tahoe. Thank you La Niña/El Nino!
East-Weighted El Nino
It looks as if this is going to be a strongly east-weighted El Nino event, with likely only a weak El Nino in the 4 region. What kind of relationship do east-weighted El Nino events have on the global temperature a few months later? I know that central-weighted, El Nino 3.4 events has a well-proven relationship to increased global temps a few months later.
El Nino and global temperatures
I am not aware of any studies that have focused on precisely how the "flavor" of El Nino affects its impacts on global averaged temperature. I note that regardless of whether this event is centered more toward the east or west, if the event is moderate-to-strong, then it likely will have a significant impact on global temperatures. I believe that the longitude of strongest warming would be, at most, a secondary effect. If I could speculate (again, I'm not aware of any studies), then I would think, all else being equal, warming in the east would have a little less impact than warming in the central Pacific because warming in the eastern Pacific generally has less impact on atmospheric convection due to the cooler sea surface in that region.
Central Great Plains
El Nino's a best friend to seasonal forecasters, but not necessarily to those who forecast for the U.S. central Great Plains, correct? So we can just hold our breath and wait to see what El Nino brings us. (Or am I missing something?) Thanks.
El Nino and the Central Great Plains
El Nino may not have a dominant influence on the climate of the Central Great Plains, but it can tilt the odds slightly. For example, last year I showed the influence of both preceding and concurrent La Nina on US summer temperatures, and there is some influence on Great Plains temperatures. For El Nino, we would expect the opposite of what I showed - a tendency toward cooler conditions (but we should consider both the preceding and concurrent ENSO conditions).
El nino
Always like reading your updates on how the weather streams work .I find it very interesting so I will be watching for your next updates 😊
El Niño impact to lakes
Thanks for this information. As a lake scientist, it’s helpful in anticipating the response to warmer than normal air and water temps on lakes that are sensitive/vulnerable to the various meteorological manifestations of this phenomenon.
El Niño
Thanks!
Thanks !
Great information. I lackadaisically study the weather because it was ingrained in me as a pilot.Even ground bound, I'm constantly trying to correlate stuff like high dew points and when it will rain.
Thanks for adding another piece of the puzzle - great work !
Thanks for the explanation!
Thanks for the great explanation! I’ve read several that just did not make this more understandable.
Monsoon
How does El Nino affect the Monsoons in Arizona, Four Corners area? For the past two years we had flooding in the region continuing with heavy and wet snow into the fall an winter, (also cause flooding). Can we expect similar a similar weather pattern 2023?
The impact is usually felt…
The impact is usually felt more in the winter and spring as a stronger jet stream brings more storms into the Southwest than normal leading to above-average precipitation.
will the sun come out in Cali during that time?
I just hope we get more sun in California. This winter and spring were pretty depressing. From Feb to May, I didn't recall 3 consecutive days where the sun came out in LA. Hopefully that's a separate issue and it will go back to normal.
Apologies is this has 1)been asked, 2) was in piece and missed i
Or #3) makes no sense.
I’m a tad confused about the way to think about higher (to ground/sea level) pacific water currents vs. lower, deeper pacific currents? I’ve maybe read (or heard discussed) that the salinity of the water from the northern hemisphere melting has affected the current temperatures and I was just wondering if you could send me a link or whatnot regarding that process? Does it accelerate or have any affect of the larger El Niño trends/behaviors? Thanks in advance! I’m up late because I can’t sleep and so I googled El Niño, you know, to relax. Oops. But it’s helpful to know some of this stuff! Great work and thanks so much in advance
ocean currents
This website and the links therein may be a good primer on ocean currents. Regarding the effects of melting ice on currents, you may be thinking of the slowdown of the Atlantic Meridional Overturning Circulation (AMOC) - this NASA website gives some good information about that. The possible effect of a slowing AMOC on El Nino/La Nina is a good question and something that I don't think is settled. This recent study suggests a slowdown of the AMOC contributes to more ENSO variability, which would mean more extreme swings from La Nina to El Nino. However, more research is needed.
El Nino
I live in Chico, California. Will this predicted El Nino affect us up here in NorCal?
El Nino and Northern California
On average, El Nino has brought wetter-than-average winters to northern California, but as these plots show, this signal seems to be most consistent for the strongest El Nino events. It's still too early to tell how strong this event will be. The temperature signal is pretty small, but there is a weak tendency for warmer-than-average conditions in northern California. If you would like to create your own plots of typical El Nino conditions over the USA or even over the globe, then this site is pretty useful.
El Nino in Central California
I live in Livermore, CA, in the East Bay area of Central California. There is all this hype about El Nino, but we have never seen a consistent response where we live. Sometimes it means drought. Sometimes it means flooding rains. Sometimes it means nothing at all. Painting big pictures of the impact on climate doesn't do much good in managing our day-to-day lives, here on the edge of the subarctic rain path.
It's not going to guarantee…
It's not going to guarantee anything that's for sure, but for February-April season, historically El Nino brings enhanced precipitation about 60-70% of the time to the Bay area.
El Nino
How does El Niño affect the Western United States?
Historically, it leads to…
Historically, it leads to wetter conditions across California and drier conditions in the Pacific Northwest. However, this will vary by season (usually during winter/spring). The current CPC outlook is here: https://www.cpc.ncep.noaa.gov/products/predictions/long_range/
Tonga eruption
Any idea about what the addition of all the incredible amounts of water vapor added to the stratosphere from the Tonga eruption will do in combination to El Nino?
If you are asking in terms…
If you are asking in terms of global temperatures both will have a warming influence.
In terms of the eruption impacting the development of El Nino that is still uncertain. Though I'm sure there will be research on the topic.
El Nino in World
Current state?
Can we have a new Update about the current state of El Nino?
Add new comment