Surf’s up: How does ENSO impact Hawaii?
With so much focus here and elsewhere on how ENSO (El Niño-Southern Oscillation) impacts the conterminous United States, our friends in the 49th and 50th states might feel a little neglected. As a former resident of Hawai’i, I am happy to throw the spotlight onto a state that is still near and dear to my heart. Here I attempt to channel the Aloha Spirit and explain how ENSO impacts the weather of our most remote state. (Alaska, don’t worry, you’re up next month!).
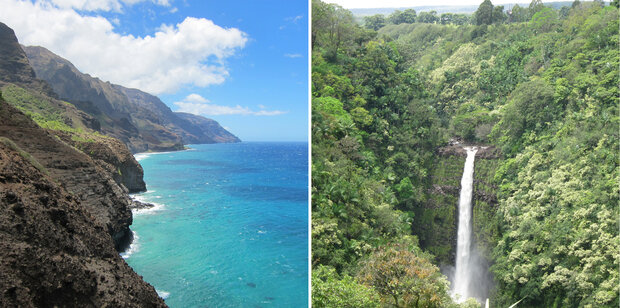
Some of the breathtaking views I experienced during my hikes in Hawai’i, demonstrating the contrast between the dry, leeward coastal regions (left) and the lush, windward regions with abundant rainfall (right). Photo courtesy Nat Johnson.
Recipe for rainbows
Before I discuss any ENSO impacts, I would like to say a few words on the unique climate of Hawai’i. When I moved there in 2009, I was immediately struck by how much the rainfall can vary over such short distances—it seemed like I could experience multiple climates during my long walks. Despite being a small state in terms of area, the average annual rainfall ranges from as little as 8 inches per year on the summit of Mauna Kea, the state’s highest point on the island of Hawai’i, to as much as 400 inches per year in the wettest parts of Maui.
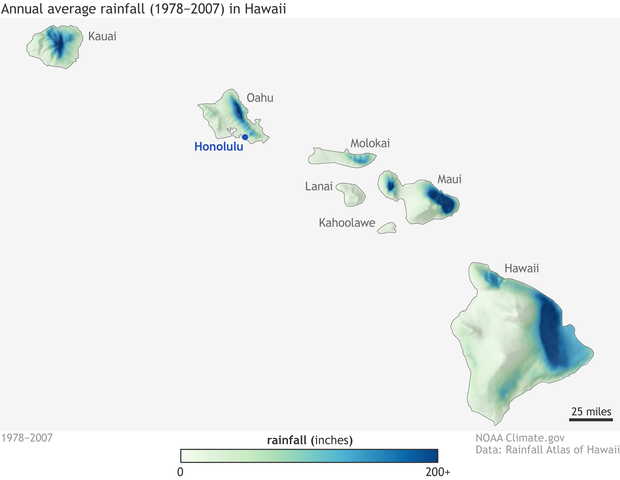
Average annual rainfall in Hawai’i, which shows the remarkable contrasts between the wet, windward regions primarily in the eastern parts of the islands and the much drier leeward and high-elevation regions. NOAA Climate.gov image created with rainfall data from the Rainfall Atlas of Hawai’i as described in Giambelluca et al. (2013).
These rainfall variations are largely shaped by the northeast-to-southwest trade winds interacting with the islands’ varying topography. The trade winds carry moisture that is lifted along the mountain slopes, which then condenses into clouds that cause frequent rainfall on the windward slopes. Meanwhile, the leeward island regions lie in the “rain shadow” of these trade wind-induced showers, resulting in much less annual rainfall. The driest regions of the state are found in the highest elevations above the “trade wind inversion,” a layer of the subtropical atmosphere a little over a mile above sea level, above which temperature rises and moisture diminishes sharply (1). It’s usually simultaneously sunny and rainy somewhere on the islands, which is why it’s a land of abundant rainbows.
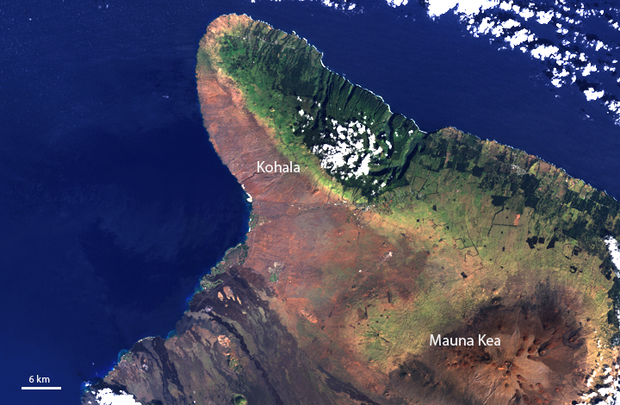
Ancient eruptions from the extinct 5,480-foot Kohala and the 13,796-foot dormant Mauna Kea Volcanoes shaped the mountainous northwest portion of Hawaii's Big Island, seen in this Landsat 7 satellite image from January 2001. Clouds hover over the lush, dark green forests on the rainier eastern slopes, while drier western slopes appear mostly earthy-brown. The sharp contrast in vegetation is called the rain shadow effect. Landsat data provided by the United States Geological Survey’s Global Visualization Viewer.
Hawai’i has two primary seasons—a summer dry season from May through October and a slightly cooler winter wet season from November through April. The trade winds dominate during the dry season, still bringing windward showers but leaving the leeward regions largely rain-free. During the rainy season, the trades are often interrupted by larger-scale rain-bearing weather systems, such as storms known as “Kona lows” and frontal passages, which bring widespread rain even to the leeward regions that otherwise escape the brunt of the rain-bearing trades.
A little ENSO sprinkled in
So, how does ENSO factor into Hawai’i’s climate? ENSO primarily makes its mark during the winter rainy season, especially in January and February (2). During a typical La Niña, the contraction of the Pacific jet stream creates an environment more favorable for Kona lows, other upper-level low pressure systems, and cold fronts from the mid-latitudes to reach the Hawaiian islands.
That leads to an elevated likelihood of a wet winter during La Niña. In a typical El Niño, in contrast, the Pacific jet stream extends farther east and places Hawai’i in a region where sinking air prevails. That means El Niño is favorable for below-average rainfall in Hawai’i. For surfers, though, El Niño is sometimes associated with bigger swells and larger waves thanks to distant effects from the extended jet stream.
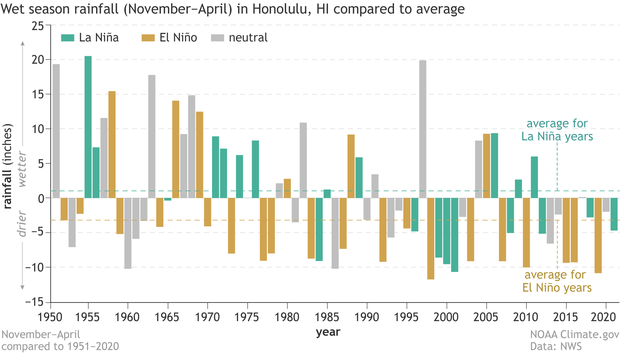
Rainfall departures from the 1951-2020 average (in inches) in Honolulu, Hawai’i for each November – April wet season from 1951 through 2021. Green bars indicate the occurrence of La Niña whereas brown bars indicate the occurrence of El Niño from November through at least February of that season. Grey bars indicate ENSO neutral conditions. The horizontal green and brown lines show the average rainfall departures for La Niña and El Niño, respectively, indicating that La Niña typically brings wetter-than-average conditions and El Niño drier-than-average conditions. NOAA Climate.gov image created with rainfall data obtained from the NOAA National Weather Service.
We can see these rainfall tendencies when we view the time series of wet season rainfall since 1951 at Honolulu, Hawai’i. The green bars, indicating the occurrence of La Niña, tend to be above zero, meaning generally above-average rainfall during La Niña, especially in the first half of the record (more on that below!). The brown bars, which indicate the occurrence of El Niño, show the opposite tendency of below-average rainfall.
La Niñas have brought about an additional inch of rainfall above the long-term average, whereas rainfall has been about 3 inches below average during El Niño (for reference, Honolulu receives about 20 inches of rain per year). Clearly, this tendency does not hold for every season (no surprise to anyone who has read any of our winter outlook posts), but the relationship is strong enough that ENSO may tilt the odds toward a wetter or drier Hawaiian winter.
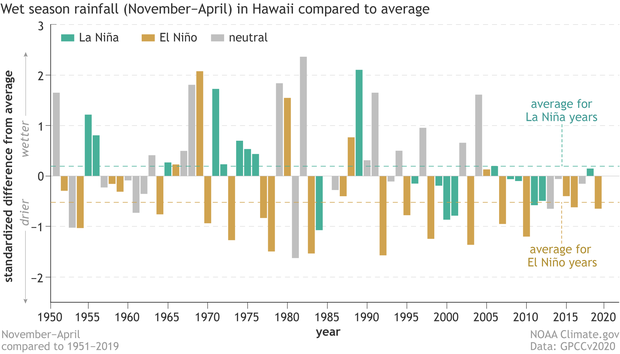
Rainfall departures from the 1951-2019 average for the state of Hawai’i for each November – April wet season from 1951 through 2019, expressed as relative changes (standard deviations) from the long-term average. Green bars indicate the occurrence of La Niña whereas brown bars indicate the occurrence of El Niño from November through at least February of that season. Grey bars indicate ENSO neutral conditions. The horizontal green and brown lines show the average rainfall departures for La Niña and El Niño, respectively. NOAA Climate.gov image created from analysis by Nat Johnson with rainfall data obtained from GPCCv2020.
When we construct a rainfall index for the entire state of Hawai’i, we see the same general tendency of above-average La Niña rainfall and below-average El Niño rainfall. Despite the remarkable diversity of Hawai’i’s rainfall patterns, the climatic influence of ENSO is similar throughout the state.
A little help from La Niña, please!
Another conspicuous feature of both the Honolulu and the Hawaiian rainfall time series is the persistence of dry conditions over the past decade or so despite the occurrence of several La Niña winters. Hawai’i is currently experiencing significant drought, with three of the islands reaching exceptional drought conditions. We may have expected the ongoing La Niña conditions to provide some drought relief, but unfortunately it hasn’t happened. What’s going on?
Unfortunately, there are no easy answers. A study published several years ago (O’Connor et al. 2015) suggests that there was a change in 1983, after which La Niña brought much less rainfall to the Hawaiian islands. Consistently, the average Honolulu rainfall anomalies during La Niña dropped from 7.2 inches above average before 1983 to 2.5 inches below average after 1983, and a similar drop is seen in the Hawaiian rainfall index. They speculated that warming ocean temperatures in the western tropical Pacific may be a reason for the changing relationship with La Niña.
Another recent study (Eischeid et al. 2022) suggests that recent conditions in the tropical Pacific should have favored wetness in Hawai’i, and that internal climate variability may be responsible for the difference between reality and expectations. That means that the La Niña influence still would have been for wetness in Hawai’i over the past several decades, but chaotic weather and climate variability would have offset the La Niña influence. It’s impossible to prove that internal variability is the culprit, but it’s often almost as difficult to rule it out.
The bottom line is that the persistent dryness of Hawai’i, especially during recent La Niñas, is still a bit of a mystery. In the meantime, the scientific community will continue searching for answers while hoping that Hawai’i’s drought comes to an end.
Footnotes
- If you would like more details on the processes that shape Hawai’i’s rainfall, I recommend this site from the Geography Department at the University of Hawai’i at Mānoa.
- Though not a focus of this blog post, ENSO also can impact the occurrence of tropical cyclones in the vicinity of Hawai’i. The Central Pacific region typically receives 4 or 5 tropical storms per year, and occasionally these storms approach Hawai’i. El Niño typically favors above-average Central Pacific tropical cyclone activity, whereas La Niña favors below-average activity.
- ENSO also can affect sea levels in Hawai’i. La Niña tends to bring higher sea levels, which can cause disruptions to coastal communities, as discussed in this article.
Comments
ENSO Rainfall anomalies
Thanks Nate for this very interesting piece. Amazing how the swings of ocean temperatures bring about Pacific-basin wide differences.
On the other side of the coin, El Nino, here's an interesting NASA SVS video of rainfall and anomalies. The data were computed from the international constellation of precipitation-relevant satellites, numbering about 10 during this time. The computational scheme was developed as part of the Tropical Rainfall Measuring Mission (TRMM),
https://svs.gsfc.nasa.gov/30766
great animation
Thanks for passing this along! The summer of 2015 was an interesting one for Hawaii because there were four tropical cyclones that passed near the shores of Hawaii, the second most since 1966. We can see the rainfall from those tropical storms and hurricanes in the link that you provided. The extreme El Nino was likely a factor, though my colleague Dr. Hiro Murakami argues that the warming in the subtropical Pacific associated with the Pacific Meridional Mode actually was the dominant factor for so many tropical cyclones near Hawaii. He makes his case in this paper.
Atmospheric Rivers?
Nat,
Again, thanks for article. Curious what the recent research about atmospheric rivers might imply for Hawaiian rainfall fluctuations?
Cheers,
Joe
Joe, I'm not aware of any…
Joe,
I'm not aware of any literation relating Hawaii rainfall and atmospheric rivers, particularly linked to the phases of ENSO. Maybe somebody else can chime in if they're aware of something I'm missing.
Helpful and interesting
Very interesting and helpful. Are there any sources which talk about about the incidence of Hawaii hurricanes/tropical storms under different ENSO scenarios?
It's not very specific to…
It's not very specific to Hawaii, but there is an article that covers this relationship here: https://www.climate.gov/news-features/blogs/enso/impacts-el-niño-and-la-niña-hurricane-season
Hawaii and Hurricanes
Aloha, I am very curious how past El Nino events have impacted the Hawaiian Islands. Over the past decade it seems that more tropical cyclones have either hit or come very close to several of our islands. Hurricanes which develop off Mexico and head west seem to hit a pocket of cooler water and either disapate or move northwest which takes them north and east of Hawaii. However, as you might remember Hurricane Eva hit Kauai quite hard and then years later Iniki destroyed Kauai. I also experienced a hurricane which hit the east side of the Big Island of Hawaii in 2014. It's always said that Hawaii never gets tropical storms or Hurricanes but it sure seems like when they develop just north of the equator and strengthen rapidly as they turn north right into the Hawaiian waters. So how does the strength of El Nino impact Hawaii according to past records and future forecasts as global warming has changed Hawaii in many ways over just the last several years, however it seems that change is occurring much faster here than we anticipated. Any information would be appreciated.
Mahalo,
Hawaii and Hurricanes
Hi there.
Tropical cyclones, including tropical depressions and named storms are more common the central Pacific (180 to 140W) during El Nino years. During El Nino years, the central Pacific will average 6.3 tropical depressions and named storms, while during La Nina and Neutral years (anything not El Nino), 3.4 is the average.
For just hurricanes, 2 hurricanes during EN years, while 1.3 is the average for non-EN years. That's stable no matter if one uses Jul-Sep or Aug-Oct for declaring El Nino or La Nina.
El Nino and tradewinds
Hi,
Thanks for this in depth article !
Is there any documented relationship between ENSO and trade winds over the islands ? In other words, are you aware of any change in the wind pattern (weaker winds, even switching to Kona SW winds) in strong EN events like we seem to have this year ?
Mahalo !
Hi Oliver, Good question…
Hi Oliver,
Good question. During El Nino events, the trade winds over the islands typically are weaker than normal and even occasionally westerly.
El Ninos are also often associated with occasionally big swells impacting the islands in Winter.
Add new comment