June 2023 ENSO update: El Niño is here
El Niño conditions have developed, as the atmospheric response to the warmer-than-average tropical Pacific sea surface kicked in over the past month. We expect El Niño to continue into the winter, and the odds of it becoming a strong event at its peak are pretty good, at 56%. Chances of at least a moderate event are about 84%.
El Niño—the warm phase of the El Niño-La Niña climate pattern—changes global atmospheric circulation in known ways, giving us an idea of potential upcoming weather and climate patterns. A stronger El Niño means global temperature, rain, and other patterns are more likely to reflect the expected El Niño impacts. I’ll get into some of the details of those impacts later in this post.
The circus is in town
El Niño conditions are present when we have met all the criteria of our decision tree.
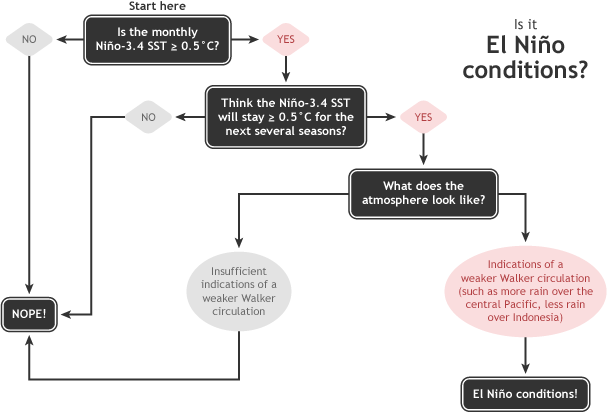
Summary of NOAA decision process in determining El Niño conditions. NOAA Climate.gov drawing by Glen Becker and Fiona Martin.
The monthly Niño-3.4 index, which tracks the temperature of the surface of the tropical Pacific ocean, was 0.5 °Celsius (0.9 ˚Fahrenheit) above the long-term average (long-term = 1991–2020), according to the OISSTv2.1 monthly dataset. 0.5 °C is the threshold for El Niño, so… check! The warm-up following our recent La Niña has been pretty remarkable. We even clocked in a 0.8°C value over the past week in the same dataset, so temperature anomalies are continuing to increase.
Animation of maps of sea surface temperatures in the Pacific Ocean compared to the long-term average over five-day periods from the end of January to early June 2023. The waters in the key monitoring region, which scientists call "the Niño-3.4 region," start out cooler than average (blue) and progressively become warmer than average (red) as La Niña ends and El Niño arrives. A higher-resolution version of this animation is available as a movie. NOAA Climate.gov, based on Coral Reef Watch maps available from NOAA View.
We anticipate that it will remain above this El Niño threshold for the next several months, based on climate model predictions and current conditions in the tropical Pacific (more on this in a minute)… check! There are the first two of our three rings criteria.
The flying trapeze
The third criteria, “indications of a weaker Walker circulation,” refers to the average atmospheric pattern over the equatorial Pacific. The average Walker circulation is characterized by rising air and storms (convection) over the very warm waters of the far western Pacific, west-to-east winds high up in the atmosphere, descending motion over the relatively cooler waters of the eastern Pacific, and the trade winds—east-to-west surface winds. These strong surface winds help to keep the warm water piled up in the western Pacific.
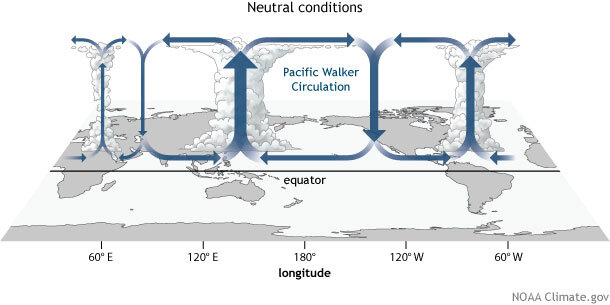
Generalized Walker Circulation (December-February) during ENSO-neutral conditions. Convection associated with rising branches of the Walker Circulation is found over the Maritime continent, northern South America, and eastern Africa. NOAA Climate.gov drawing by Fiona Martin.
El Niño’s warmer-than-average surface water alters this circulation by bringing more rainfall and convection to the central and eastern Pacific. The trade winds weaken, which allows the surface to warm further, allows warmer water to slosh back eastward, and reinforces the El Niño sea surface temperature pattern. This is the critical feedback mechanism indicative of El Niño.
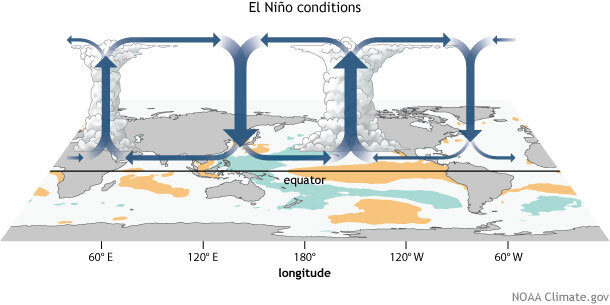
Generalized Walker Circulation (December-February) anomaly during El Niño events, overlaid on map of average sea surface temperature anomalies. Anomalous ocean warming in the central and eastern Pacific (orange) help to shift a rising branch of the Walker Circulation to east of 180°, while sinking branches shift to over the Maritime continent and northern South America. NOAA Climate.gov drawing by Fiona Martin.
Over the past month, evidence of the weakened Walker circulation appeared in the form of weaker trade winds over the western Pacific and more clouds and rain over the equatorial Pacific. Convection over Indonesia was reduced, too, another characteristic of the weaker Walker circulation.
We quantify the atmospheric component of El Niño using the Equatorial Southern Oscillation Index (EQSOI) and the Southern Oscillation Index (SOI), both of which compare the surface atmospheric pressure in the western Pacific to that in the eastern Pacific (more details on these indexes here). Both measured -1.0 standard deviations in May (meaning the indexes were lower than about two-thirds of all measurements), providing significant indication of the weaker Walker circulation and further evidence that the ocean-atmosphere system has coupled and El Niño conditions have developed.
Ringmaster
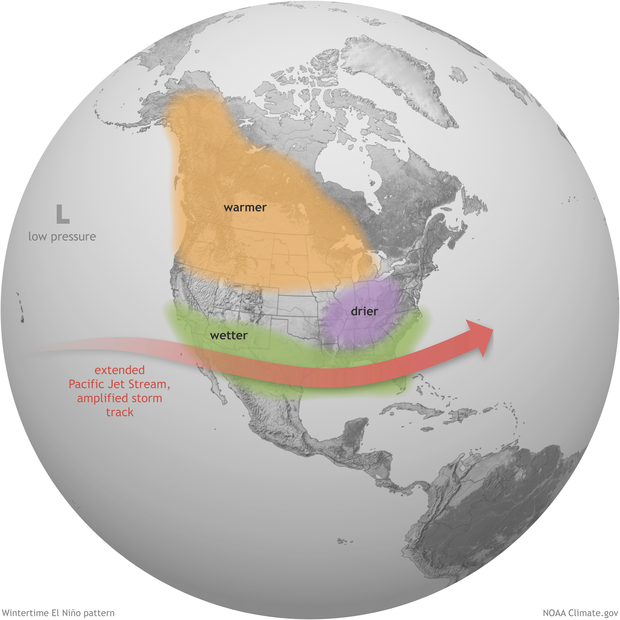
We spend so much time and energy studying and forecasting El Niño (and its counterpart, La Niña) because those changes to the atmospheric circulation have global impacts. In a one-paragraph nutshell: warm air that rises near the equator moves toward the poles high up in the atmosphere, descending again near 30 °N and 30 °S, in an overturning pattern called the Hadley circulation. The Hadley circulation is connected with the jet streams over the middle to high latitudes, which steer storms around the world and separate cold and warm air masses.
As El Niño heats the atmosphere above the central and eastern tropical Pacific, it leads to a stronger Hadley circulation and changes to the jet streams. For example, in an El Niño winter, an extended North Pacific jet stream tends to bring more storms across the southern tier of the U.S. and warmer air to the northern half of North America.
Since El Niño can usually be predicted months in advance, we can anticipate these changes and their impacts. When El Niño is stronger, meaning the sea surface temperature is much warmer than average, it has a stronger hand in changing global circulation, making the impact patterns more likely.
Of course, nature is full of surprises, and while El Niño makes certain patterns more likely, we never get exactly what we expect! For more on this high-wire act, I’ll let the titles of these two posts speak for themselves: “Not what I ordered: How El Niño is like a bad bartender,” and “No, you can’t blame it all on El Niño… but it’s still a seasonal forecaster’s best friend.”
Fire breather
Along with the atmospheric signs, the subsurface ocean is also providing confidence that El Niño will continue.
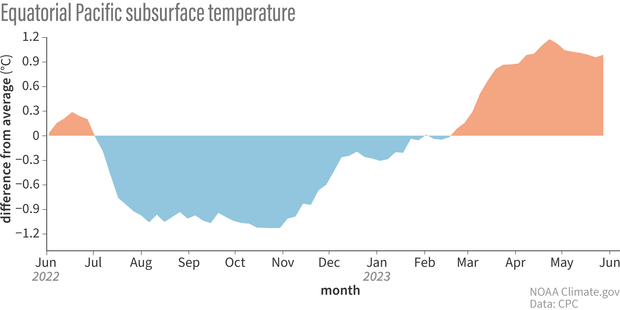
Graph showing the average temperature over the past year of the top 300 m (~1000 ft) of the Pacific Ocean, 180-100°W departure from the long-term (1991–2020) average. Graph by climate.gov from CPC data.
There is currently quite a lot of warmer-than-average water under the surface of the Pacific, as one downwelling Kelvin wave (an area of warm water that sloshes from the west to the east under the surface) has passed through and another is emerging. In fact, the May 2023 average subsurface temperature was the fourth-warmest May value in our record (1979–2023). This definitely isn’t a 100% certain indicator that a strong El Niño will develop, but it is suggestive. The top two May values were 1997 and 2015, both of which preceded strong El Niño events, but the third, 1980, did not.
Bring in the clowns
As I mentioned above, nature always has surprises in store, and predicting anything several months in advance is difficult. While El Niño conditions have developed, there’s still a small chance (4-7%) that things will fizzle out. Clearly, we think this is unlikely, but it’s not impossible. The incredible warmth of the global oceans could throw us a curveball, since we’ve not seen this before. Another potential, but also less likely, outcome is a weak El Niño, with about a 12% chance. Check the probabilities for all El Niño outcomes here and read more about forecasting El Niño here.
In coming months, I’ll keep you updated on the development of this El Niño. We’ll also have deeper dives into some El Niño impacts, including a post on El Niño’s interaction with global temperature coming up in a couple of weeks. As Nat discussed last month, global temperatures are running way above average, and that has only continued recently. Thanks for spending your time under the big top with us!
Comments
Thanks for the update
Thanks for the update about the start of El Niño. It will be very interesting seeing how this impacts the weather here in Oklahoma, particularly this fall in winter.
El Nino
Has anyone estimated the total amount of water vapor above nominal in comparison to later years content. Another way to ask the question is how much water in gallons is held aloft in the atmosphere and is water vapor being seen at ever higher elevations?
Yes scientists have looked…
Yes scientists have looked at this. Here is a carbon brief guest article written by one of the authors of this paper on marine humidity trends.
El Nino
Great info. Keep it coming
Latest El Nino update.
Concise and an easy read. Thanks!
Thank you
Really appreciate the write up, the graphics, and the education!
Weak El Niño I heard
Stop saying super El Niño i hardly had winter last year because El Niño ruin La Niña
super?
I don't recall reading any claims here of a "super El Niño," just a discussion of the range of possible outcomes, with uncertainty for each outcome. As Emily discussed and as shown here, the probability of a strong (but not necessarily "super") El Niño rises above 50% for next fall and winter, where "strong" is defined as Niño-3.4 index values exceeding 1.5C. For context, the highest seasonal Niño-3.4 index values have reached around 2.5C in the strongest El Niños.
El Nino
This year's El Nino did not ruin last year's La Nina. One has nothing to do with the other. El Nino or La Nina is never a guarantee of anything. Here in California we've had two consecutive dry winters under La Nina and last year was wet. If you look historically (very roughly speaking) it sort of falls into the ratio of about 2/3s of La Ninas ending up being dry in CA.
La Nina / El Nino effects in North of Minas Gerais (Brazil)
Good obrservation!
Here is the same.
Look historically we’ve got dry and wet summers above lá nina and el nino.
We need anothers ways to predict about the quantity of rain.
No you got that wrong last…
No you got that wrong last season was a moderate La nina...
Officially, DJF 2022-23 was…
Officially, DJF 2022-23 was a weak La Nina according to our official metric for historical ENSO episodes: https://www.cpc.ncep.noaa.gov/products/analysis_monitoring/ensostuff/ONI_v5.php
This also implies the forcing from the tropical Pacific was quite weak too. By JFM 2023, we were Neutral.
Wrong
It’s going to be a massive El Niño
Great post, thanks!
Just wanted to say thank you for your regular updates to the ENSO blog, always to-the-point and very clear, with great analogies to convey key points.
Weird Weather
Great update! Do you think there is any relationship between the developing El Nino and the never ending string of cut-off lows that have been affecting the Reno-Tahoe area the last few weeks?
El Nino and California cut-offs
Given that this El Nino is just getting going, and typically the impact of El Nino on the midlatitude atmospheric circulation is pretty weak this time of year, I think it's doubtful that El Nino is the main culprit for the weird weather you describe. I couldn't say that it has had no effect, given that the tropical circulation anomalies associated with El Nino could have impacted the North Pacific/North America circulation in some way, but it would take a thorough analysis to make such a confident conclusion.
El Niño effects in June 2023
The strong, persistent upper-level trough feature over SE Canada, Great Lakes & the NE US during June 2023 is indeed consistent with El Niño, upper-level weather patterns. During a typical June, the polar jet typically is more zonal. But this year, perturbations in the mid-latitude atmospheric circulation in the northern West Hemisphere are a result in wind reversals taking shape. This process is creating nearly stationary, large amplitude oscillations in the jet stream.
El cooler SoCal
Does this explain why SoCal has experienced much cooler than average daytime temperatures since the beginning of December 2022? Typical daytime highs are 5-10 below average, and I can count the number of days in the past 6+ months that we reached or exceeded average on my fingers. The high rainfall over the same period seems to fit the El Nino pattern.
Cooler SoCal
I don't think El Nino can be blamed for the cool SoCal conditions you describe. Actually, the cool ocean conditions off the West Coast may be, in part, a remnant of the La Nina that ended just a few months ago (things have been changing fast in the Pacific!). El Nino tends to bring warmer ocean temperatures off the West Coast, so I would expect things to warm up eventually. El Nino actually tends to bring less May and June gloom to coastal California, so maybe next spring will be a little less gloomy!
To be or not to be....
So El Nino has been declared? Headline says El Nino is here but we appear to still be in El Nino Watch or Warning....confused..
El Nino Advisory
Before yesterday (Thursday, June 9th) and starting in April, we were under an El Nino Watch, meaning that conditions were favorable for the development of El Nino within the next 6 months. As of yesterday, the El Nino Watch was upgraded to an El Nino Advisory, meaning that El Nino conditions are now here.
Got it
Got it! Thank you.
El nino to be or not
El nino is there we have seen the current warming of Pacific sea surface
La rainfall
Because of El Niño as well as other factors Los Angeles has a good chance of having the wettest year on record in 2023-24 Rainy season.
Re: LA rainfall
El Nino will tilt the odds toward a wetter winter in LA, though it likely would take other currently unpredictable factors working in tandem with El Nino to make it the wettest year on record.
El Nino and the PDO
How long after a true El Nino forms will the PDO phase from a negative to a positive ? I believe that we won't feel the effects of El Nino until the PDO turns positive ?
Re: El Nino and PDO
I would not expect El Nino to have a significant influence on the PDO index until winter, when El Nino would be expected to have a big impact on Aleutian low strength and location. A turn to a positive PDO index would be an indication that the North Pacific atmosphere and ocean are responding to El Nino in the expected way, but it's important to keep in mind that there's a component of the PDO unrelated to El Nino that may not be connected with El Nino impacts.
Wet last winter, but then...
Given that California had above average rain and snow in neutral conditions last season, but with an onset of positive temperature deviations, does that factor into this new event?
The interesting part (to me)…
The interesting part (to me) about last winter was the very rapid decay of La Nina. We had a very weak event going on in Dec.-Feb. according to our historical ENSO classification. By Jan-Mar 2023, we were Neutral. Some of that precip may have come when we technically did not have a La Nina event going on (or it was so weak that the forcing may have been weak).
Wyoming rain
I know we are supposed to be above normal warmth this year because of El Neno but this is soooo wrong here, it’s actually been cold and forecasters are showing thunderstorms and 60 and 70 degree weather and we are into June by 2 weeks. I know it’s Wyoming but i really know that our weather isn’t behaving like an el neno is supposed to. We do get warm here, but it’s in July we may have a week of really hot 90’s feels like we are going to die, but we cool down at night to the 50’s usually every night. Let’s see if El neno is coming right now I walk my dog at 3 am in 40 degree weather and it’s June.
So, technically, El Nino…
So, technically, El Nino just formed so is pretty weak... that means that it is unlikely that any current impacts you are experiencing are due to El Nino. Also, keep in mind that El Nino impacts over North America tend to be strongest during the upcoming winter and following spring. Impacts during the summer are typically weak even with a full blown El Nino in place.
El Nino
No mention of hot water anamolies, present in three parts of the ocean, one the north atlantic, which are a never before present occurance to coincide with this el nino.
What will be those impacts? Are we left to just guess?
Nat went over the incredible…
Nat went over the incredible warmth of the global oceans last month. As for its influence on the forecast, we have to hope climate models, which are taking in account this oceanic warmth, are able to do so with some accuracy.
So, should we go to Alaska this July? :)
So, we just want to know if Alaska Southcentral/Gulf will be a rainy mess this July. LOL. It seems to be quite possible. Should we cancel now?
We can't say with certainty,…
We can't say with certainty, but CPC forecasters do provide probabilities for 1-month and 3-month averages for Alaska. Find them here and here.
What triggers the conditions that lead to El Nino
Has anyone been able to identify the trigger factor? Something in this cycle that causes the shifts?
Because ENSO is a coupled…
Because ENSO is a coupled system it is not always clear what the ultimate "trigger" was. It could have started with more westerly wind anomalies in the western Pacific Ocean. It could have also started with slower oceanic adjustment processes. The transition from La Nina to warmer conditions in the Nino3.4 region was pretty well forecasted by the NMME models as far back as last autumn.
El Nino
Ann:
El Ninos form when average global temperatures rise. They are an effect of the increased temperatures, and do not cause any temperature increases by them selves.
The development of El Niño…
The development of El Niño leads to higher average global temperatures: more on how this works here and here.
GSM
Does the Grand Solar Minimum GSM have an impact on this prediction?
It is not an explicit…
It is not an explicit predictor, though if it's an element in any of our global climate models, then it's implicitly accounted for there.
I like graphs
Hi, I always enjoy your blog. Would it be possible to toss in a "long term average graph"(the twenty year one) for the 3.4 area into an upcoming blog? Maybe you've done one recently and I missed it. Maybe even relate or juxtapose it to Global ocean average if you have that too, since you mention it :) . I'm just itching to see what that twenty year average looks like going as far back as your data goes.
Thanks
"Long term" trends were…
"Long term" trends were discussed recently here:
https://www.climate.gov/news-features/blogs/how-pattern-trends-across-tropical-pacific-ocean-critical-understanding-future
The trend in the Nino3.4 region is close to zero since 1980. If you want 30yr climatology/averages, then you can get those numbers from this plot (using ERSSTv5 data):
https://origin.cpc.ncep.noaa.gov/products/analysis_monitoring/ensostuff/ONI_change.shtml
Toward the bottom of this page is a link that gives you the Nino3.4 climatology numbers in the 4th column. Hope this helps!
Winter 2023/24
Winter snow during ski season 20/21 and 21/22 in the southwest was below normal. Does El Niño mean similar snow fall for winter 23/24 as winter 22/23?
Like the rainfall patterns,…
Like the rainfall patterns, snowfall trends toward snowier in the southern tier of the U.S. and drier toward the north. https://www.cpc.ncep.noaa.gov/products/precip/CWlink/ENSO/composites/elnino.jfm.snow.gif
thank you
This was so helpful! The article was great, and I loved the graphics especially, they made it so easy to understand. I really appreciate your time in creating this for us!
Thank you! It's always…
Thank you! It's always great to hear about someone enjoying the ENSO blog. climate.gov gets the credit for the graphics and they are free to use by anyone in presentations, etc.
Looking forward to El Nino in Kenya
Thanks for the post. I am looking forward to El Nino. It's been a rough few years of La Nina, which brings lots of droughts—currently enjoying the neutral phase.
Question on the early formation of ENSO
Is the early formation of El Nino causing the Omega Block that is currently on going ? It has been unusually cool here in the East.
It's too hard to say…
It's too hard to say definitively without some research/attribution of what is going on currently. I will admit I think the recent (May) arc of the teleconnection emanating from the Pacific Ocean is suspiciously El Nino-like. We saw increased troughing over the N. Pacific Ocean, increased ridging over Canada, and, then an anomalous trough (and cooler weather) over the eastern U.S. If it weren't May and it was the dead of winter, I would be more confident it's El Nino. But I would not expect such patterns so early on. But it's still interesting.
Add new comment