May 2023 ENSO update: El Niño knocking on the door
The tropical Pacific sure knows how to get out of a rut! Just two months after declaring the demise of an almost interminable La Niña, above-average surface temperatures have reclaimed the tropical Pacific, and temperatures in the central-eastern Pacific are expected to continue to rise. Consequently, an El Niño Watch remains in place, with El Niño conditions likely to develop within the next couple of months and then persisting (greater than 90% chance) into the winter.
We care about the potential development of El Niño—the warm phase of ENSO (El Niño/Southern Oscillation, the whole El Niño-La Niña system)—because of the cascade of global impacts that arise from its occurrence, including the expected temperature and precipitation patterns shown here. We’ll revisit many of these impacts in the coming months, but we’ll start by focusing on all the details of these rapidly developing conditions in the tropical Pacific.
On the doorstep
According to ERSSTv5 (our most consistent historical dataset), the April average sea surface temperature in the Niño-3.4 region (our primary monitoring region for ENSO) was 0.1 °C above the long-term (1991–2020) average. This value is up 0.2 °C from March and is the first time the monthly Niño-3.4 temperature was warmer than average since April of 2020.
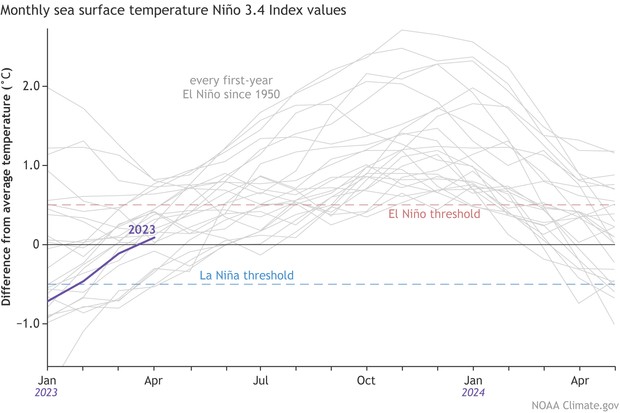
16-month history of sea surface temperatures in the Niño-3.4 region of the tropical Pacific for all events evolving into El Niño since 1950 (gray lines) and the current event (purple line). NOAA Climate.gov image based on a graph by Michelle L’Heureux and monthly Niño-3.4 index data from CPC using ERSSTv5.
When we zoom into the weekly time frame, we find that the latest Niño-3.4 measurement from our highest-resolution dataset (OISSTv2.1) was 0.4 °C above the long-term average, even higher than the latest monthly average. This is just a mere 0.1 °C away from the 0.5 °C threshold that is necessary (but not sufficient!) for declaring El Niño conditions. Subsurface ocean temperatures in the tropical Pacific also increased over the past month, providing a source of warmer water that can sustain a developing El Niño. How can La Niña seem like a distant memory so quickly?
Although the tropical Pacific Ocean looks ready to burst through that door to El Niño, the tropical atmosphere seems a bit more hesitant, remaining firmly in ENSO-neutral territory. As in March, the April Southern Oscillation Index and the Equatorial Southern Oscillation Index were close to zero, indicating that the Walker circulation remains at near-average strength. For El Niño conditions, we would expect negative values of these indexes, which would indicate (1) a weakening in the surface pressure difference that normally exists between the western and central-eastern Pacific and (2) a reduction of the east-to-west surface trade winds that are the key component of the Walker circulation. (For La Niña conditions, we get the opposite – positive index values indicating a strengthened Walker circulation and stronger east-to-west trade winds across the tropical Pacific Ocean.)
Summary of NOAA decision process in determining El Niño conditions. NOAA Climate.gov drawing by Glen Becker and Fiona Martin.
Note that even if the monthly average Niño-3.4 index soon exceeds the 0.5 °C threshold for El Niño, forecasters will not declare onset of El Niño unless the tropical atmosphere is clearly responding in the expected way, including a weakening of the Walker circulation.
Peering ahead
Forecasters have high confidence in an upcoming El Niño not only because of the rapidly changing tropical Pacific Ocean conditions but also because of the strong agreement from the latest computer model predictions. The current forecast from the North American Multi-Model Ensemble (NMME), a set of state-of-the-art computer climate models, indicates that the Niño-3.4 sea surface temperature is very likely to climb above the El Niño threshold within a couple of months and remain in El Niño territory for the remainder of the forecast period.
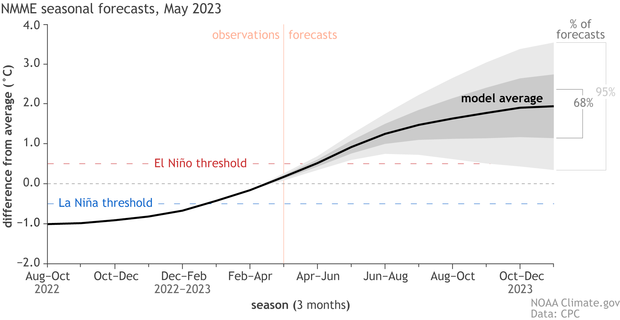
May 2023 climate model forecasts for the Niño-3.4 temperature anomaly in 2023 from the North American Multi-Model Ensemble (NMME). The black line shows the model forecast average; darker gray envelope shows the range of 68% of all model forecasts; lighter gray shows the range of 95% of all model forecasts. NOAA Climate.gov image based on a graph from Emily Becker.
In short, the signs of El Niño development that we saw last month have only grown stronger this month. Additionally, we’ve pushed one more month through the dreaded spring predictability barrier (also check out here, here, and Michelle’s latest post here). Taken together, these signals have allowed forecasters to increase their forecast confidence this month, with the likelihood of El Niño approaching 90% by summer and exceeding 90% through next fall and winter.
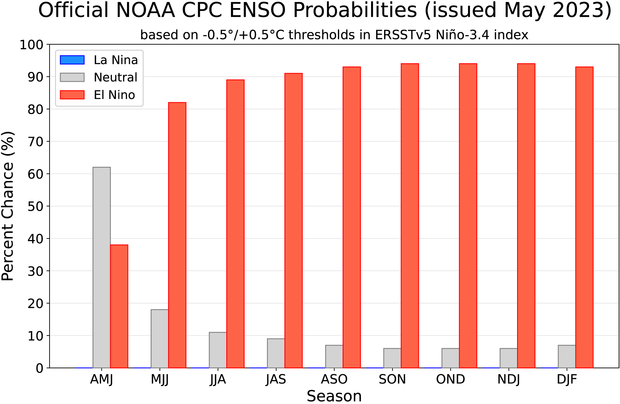
NOAA Climate Prediction Center forecast for each of the three possible ENSO categories for the next 9 overlapping 3-month seasons. Blue bars show the chances of La Niña, gray bars the chances for neutral, and red bars the chances for El Niño. Graph by Michelle L'Heureux.
The possibility of a significant El Niño is also growing. Following the method described in Tom’s post, the current chance for a strong El Niño (Niño-3.4 index greater than 1.5 °C) is approximately 55%, which is up almost 15% since last month. We may have a better handle on the potential strength of this event, assuming it develops (still a 5-10% chance it doesn’t!), once we fully get past the spring predictability barrier.
Global simmering
Warm ocean conditions are not just limited to the tropical Pacific. Despite some unusually cold ocean temperatures off the West Coast of the U.S., the remarkably warm global ocean has grabbed recent headlines.
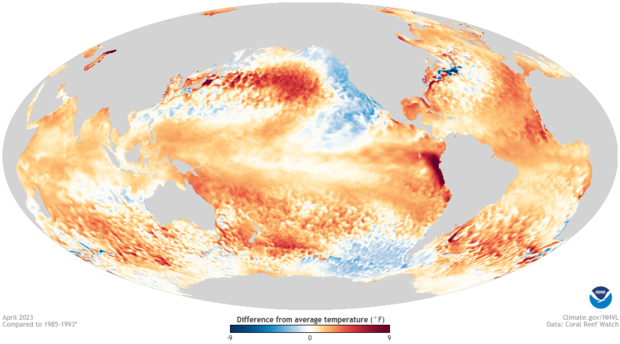
April 2023 sea surface temperature difference from the 1985-1993 average (details from Coral Reef Watch). Most of the global oceans were warmer than average. NOAA Climate.gov image from Data Snapshots.
For some additional perspective on this widespread warmth, I reached out to Dr. Boyin Huang, an oceanographer of the National Centers for Environmental Information with expertise in sea surface temperature reconstructions. Dr. Huang kindly provided the following plots of near-globally averaged sea surface temperature time series for two of our most used sea surface temperature datasets, monthly ERSSTv5 and daily OISSTv2.1.
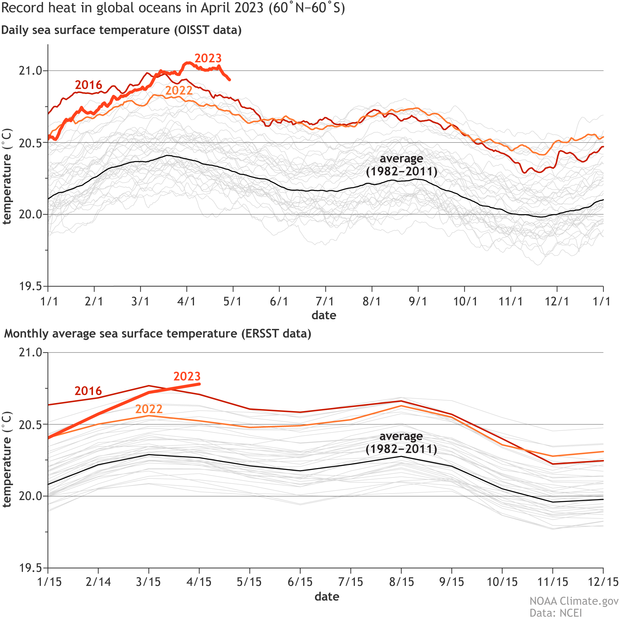
Non-polar (60 °N – 60 °S) global averaged sea surface temperature from 1982-2023 from (top) daily OISSTv2.1 and (bottom) monthly ERSSTv5 datasets. The thick black lines represent the 1982-2011 average across the calendar year; 2022 (orange line), 2023 (thick red line), and 2016 (the year of record warmth before 2023; thin red line) are highlighted. The thin grey lines represent all other years. The top graph indicates that 2023 reached record warm levels since mid-March in OISST; however, the bottom graph indicates that peak temperatures in ERSST have not clearly exceeded the record warmth of March 2016 in that dataset. Nevertheless, both datasets indicate that April 2023 was warmer than any previous April on record. NOAA Climate.gov image based on graphs by Boyin Huang and data from NCEI.
First, we note that while the two datasets are not identical, as Tom pointed out way back when, both the ERSST and OISST datasets confirm that the global oceans are currently sizzling. However, they do have minor disagreements about record warmth. Although the global (non-polar) ocean surface temperatures have been warmer than at any point over the past 40 years in the OISST dataset since mid-March, the ERSST dataset has trailed the record warmth of 2016, at least until recently. However, Dr. Huang confirms a point of agreement: both datasets indicate that the global ocean surface was warmer in April 2023 than in any previous April.
How would a developing El Niño relate to the global ocean temperatures? First, as Emily noted last month, global average temperature tends to be higher in El Niño years than in La Niña or ENSO-neutral years. Given how warm the oceans are already, a developing El Niño would only increase the chance of record-breaking global ocean temperatures (and global average temperature over both ocean and land), which likely would have important ecological consequences, including for fish and corals.
Another factor to consider is that the widespread ocean warmth may make it a little more challenging for the warm temperatures in the central-eastern equatorial Pacific to induce a tropical atmospheric response (maybe a reason for the current ENSO-neutral looking tropical atmosphere?). The reason is that the response of the tropical atmosphere depends on surface temperatures in the central-eastern equatorial Pacific relative to the surrounding regions. If those surrounding tropical regions are also warmer than average, then the bar is even higher for the Niño-3.4 region surface temperature anomalies to induce an atmospheric response (see footnote).
The bottom line is that in terms of a push on the tropical atmosphere, we need to consider that the Niño-3.4 index may punch below its weight while it’s hovering in borderline El Niño territory, as it is now. However, if the central-eastern Pacific continues to warm up, we can expect that the atmosphere will feel that push eventually.
Coming Up
You probably noticed that you aren’t being treated to the ENSO update eloquence that Emily usually provides each month. Don’t worry – Emily will be back later this month with a post talking about our favorite blend of computer prediction models, the NMME. Also, be sure to check out NOAA’s outlook for the 2023 hurricane season that comes out in just a couple weeks (May 25th). One of biggest implications of a developing El Niño in the shorter term is its potential influence on the Atlantic and Pacific hurricane seasons. In brief, Atlantic hurricane seasons tend to be less active during El Niño, while the Pacific season is often enhanced. That means this month’s ENSO forecast is likely one of the factors that will be considered in the hurricane outlook. In the meantime, keep your eyes peeled on the tropics, and don’t blink – conditions are evolving quickly!
Footnote
- This issue is why some, including Michelle of this blog, have advocated the monitoring of a relative Niño-3.4 or relative Oceanic Niño Index (RONI). The NOAA Climate Prediction Center monitors the RONI here. The RONI is simply our standard ONI (3-month average Niño-3.4 sea surface temperature anomaly) with the tropical average sea surface temperature subtracted. Such an index is less sensitive to a warming climate and, consistent with some of my earlier research, is more closely connected with changes in the tropical atmosphere than the standard ONI.
Comments
Reminder about comments
ENSO in AZ
Looks like my Valley of the Sun (aka Phoenix and suburbs) is in for a hot and humid late summer (when you get wet without going in the water!) As long as we get a wet fall and winter I am ok with it!
El Nino
It is amazing how strong the El Nino probabilities are this season. Last year at this time La Nina was not favored this overwhelmingly. Seems EL Nino is almost a given at this point. The only real question is how strong this event will be
west coast El Niño predictions-rain wind
how much rain and high winds will affect the California coast?
El Niño will be weak
No strong El Niño. It will be a weak one. U can’t predict super El Niño in 6 months I want a cold and snowy winter. I don’t trust noaa. I say die El Niño before September
The unusually cold ocean temperatures
I always appreciate the great ENSO blog for its interesting content!
I am currently wondering whether the unusually cold ocean temperatures off the West Coast of the U.S., reminiscent of a negative phase of Pacific Meridional Mode (PMM), may inhibit the development of El Nino as the negative PMM induces easterly anomalies (or impairs westerly anomalies) in the tropical Pacific. If this is the case, the El Nino conditions may grow less than expected.
Great observation! The PMM…
Great observation! The PMM is certainly not in a phase that would be conducive to El Ninos and it extends enough to the tropics that it could have some bearing on Nino3.4. This is one of those wildcard factors the contribute to that 5-10% chance of no El Nino developing along with a weaker strength event if one does form.
Other measures?
Great post and thanks for the cool and descriptive analysis. You mention RONI, what about MEI? I’ve always thought a multivariate approach a good one for defining ENSO phase. Thanks again!
Great question Greg! So the…
Great question Greg! So the MEI is a perfectly valid ENSO index for certain applications but in operations, we prefer indices that are also provided at monthly mean resolution (the ONI can be split into monthly Nino3.4 index values which can be used in real time declaration). Also, as we mention in this older blog post, it can be difficult to dynamically understand what is going on when using combined indices like the MEI. It is useful to us to see the OLR index by itself, the SOI index by itself, etc, etc. When the indices are all combined, we can't rule out that one variable is dominating the rest (Example: SSTs are consistent with El Nino, but none of the other atmospheric indices are participating). Further, the SST datasets have a lot of investment and time put into climate homogenization meaning we can, fairly confidently, compare today's value with one in the past (at least since the 1950s). I can't say the same about gridded datasets of winds, etc. And, lastly, SST trends are becoming an issue and we probably need this to be addressed for SST variables in the MEI as well. Hope that helps.
Coastal el Nino vs Walker circulation
Is the coastal El Nino blob delaying the Walker Circulation's transition to Nino?
I'm not sure that the…
I'm not sure that the coastal El Nino is having that much of impact as opposed to the general tropical Pacific wide above-average ocean warmth. The gradient is key.
Dr. Boyin Huang graphics
I could not understand the X axis in either of the two graphics. .
What does 1/1 2/1 3/1 etc in the top graphic mean?
In the bottom graphic I am assuming that 2/14 has something to do with February normally having 28 days. I was is shown the midpoint in the month rather than the average for month?
The X-axis labels refer to…
The X-axis labels refer to dates month/date
1/1 is January 1
2/1 is February 1
3/1 is March 1
Elnino update
Good information for early warning for Disaster preparedness and Risk. Reduction
Fire danger
If we get El Nino conditions, what is the outlook for fire danger in south Florida?
Florida and El Niño
Last time Floridians experienced a strong El Niño, we had a mild, extremely wet winter that supported an abundance of understory growth that was left unchecked. After an extremely dry spring, fires ran amok, ravaging most of peninsular Florida. It was after this event, that the US Forestry Service began prescribed burns on a rotational basis. These burns were called controlled burns at that time until the US Forestry Service realized that these too can become uncontrolled, so they renamed them to 'prescribed burns'.
So, we will have to wait until spring and early summer when the effects of this El Niño manifest itself in Florida.
PDO ?
Will the Pacific Decadal Oscillation go to the positive phase when a true El Nino forms or will it be delayed ?
Colder than normal SST off West Coast
The colder than normal SST off the West Coast could delay or even eliminate the formation of El Nino for the Fall and Winter ? Please explain.
Thank You,
Stephen S.
SOI Joining the El Nino Party
The most recent 30 day SOI value is now -4.82, with a daily contribution of -31. A noisy index, no doubt. However, it is steadily moving towards the value of -8 which is the prevailing 30 day SOI value for El Nino conditions. The Aussie BOM 30 day rolling average of -4.2 is the lowest such value in at least 3 years. https://www.longpaddock.qld.gov.au/soi/
http://www.bom.gov.au/climate/enso/#tabs=Pacific-Ocean&pacific=SOI
Coastal El Niño
ENSO and Coastal El Niño phenomena are related, I am a bit confused.
When one occurs, does the other necessarily occur? I am from Peru and I am worried about the possible consequences, Thank you for your answers.
Growing El Niño conditions
As a Navy Forecaster and. Now consultant for Fleet Numerical . I’ve discovered that El Niño vs La Niña Although the effects can be devastating. Generally we have had wet years during La Niña event .. this season being historically . To 2015-16 El Niño that was unusually dry. I think this needs more work to really define what the true impact is in terms of rainfall and global temps . If this next season is anywhere near what we just went through and continues as snowmelt Ramps up . We could have potential serious flooding should We experience a series of atmospheric Rivers here in Ca.
2015-2016
2015-2016 was not unusually dry. Above average precipitation for the northern half of the state but I guess if you compare it to other strong events it was unusually dry. This is a study done by researchers from UC California of the 2015/2016 El Nino versus the 1997-1998 event which was very wet. Their conclusion was the 2015-2016 was more of a CP event. Based on the comments made by the researchers here I've shared messages with they don't necessarily subscribe to that theory. This is the study that was done. It is a fascinating field of study.
https://agupubs.onlinelibrary.wiley.com/doi/full/10.1002/2016GL071515
El niño for the Caribbean
Thank you so much for your blog. Thanks to the team for all the very valuable insights.
I live in the western Caribbean and we have been going through a strong heat wave and very little rain for about one month now. This usually comes up in July and I am very concerned about water supply and crops. If this is to be a El Niño year, it will mean less possibility of hurricanes, but what about rain fall?? does it also mean dryer weather??
I have been connected to NOAA for years, now I am also looking forward to read your blog.
Thank you again for your wonderful work. Much appreciated.
Celyne Seymour
Hi Ceylne - thanks for your…
Hi Ceylne - thanks for your comment! El Niño summers do tend to be drier throughout the Caribbean. Check here for maps of El Niño's impacts. Also, if you haven't seen it already, you can find forecasts specifically for the Caribbean at NOAA's International Desks.
El Niño odds breaking down?
Saw the recent NOAA ENSO Climate Prediction Center SST time map illustration of the equatorial Pacific, as well as the Columbia Climate School IRI ENSO forecast. Very surprising to see what might be the beginnings of a break down back to neutral, despite the relatively high SST trends? (A fourth year of La Niña isn't possible..?)
If a return to neutral is the case, there are far more variables involved that models have yet to account for. That pent up oceanic heat shouldn't be breaching fundamental laws of thermodynamics, unless other surreptitious forces are at play, chuckle-chuckle!
Good work as always, looking forward to the findings of the next update!
EL Nino
The odds overwhelmingly favor El Nino through winter. The remaining realistic question is how strong this El Nino will be. La Nina will not happen this coming winter.
Lower than normal SST off the lower West Coast
Just wanted to know why this anomaly is still occuring ?
Thank You,
Stephen S.
Just look at the atmospheric…
Just look at the atmospheric circulation above the ocean waters. We are still seeing a lot of "ridging" meaning that flow along the West cost is mostly north-to-south and that brings cold water up to the surface along the coast. When that changes, the ocean temps will change too.
Spring predictability barrier
Have you forgotten about the Spring predictability barrier? Your predictions do not seem to take that into account.
Our team is definitely aware…
Our team is definitely aware of the spring predictability barrier. The probabilities take that into account. The alternative (if you don't prefer our forecast) is to use the raw model guidance instead. Though to warn you: those models are even more confident with 99.8% chance of El Nino in the months ahead...
Spring barrier
Lol. Yes but we are just about the cross the barrier and can peak across and start to see the other side
The effect of cold water from record snow pack will impact Nort
The cold melting record snow pack is reaching a peak of probable impact on North Eastern Pacific Basin. The reduced impact of cold run off will not occur until late summer months. As the rivers and streams slow down slowly, then the El Nino will have a dominance over North Eastern Pacific Basin. And then, quite probably a clearer picture of how broadly the El Nino will manifest regionally on Sea Surface Temperatures and Wind Patterns. Focusing impact anomalies and probable effects.
La Niña will happen next fall and winter
U can’t say La Niña not happening next fall and winter. Stop hating La Niña. El Niño is not good for snowy winters in Wisconsin.
La Nina
La Nina is not happening next winter. El Nino is building in the eastern pacific. Most likely an El Nino will be in full force next fall and winter. The only question really is how strong it will be.
Rain in the Valley of the Sun
El Nino just means we get 6.7 inches of rain THIS YEAR instead of the "normal" 6.2 inches in the Valley of the Sun (Phoenix area)!
El Niño effect on global SST
Thanks for the blog. I find it very informative. I have a question though. In this post you state that El Niño often leads to higher air surface temperatures, which would lead to higher sea surface temperatures. You reference an earlier post, which gives the reason for the increase in air surface temperatures. As I understood it, the reason for higher surface temps during El Niño was due to higher evaporation off the ocean, leading to increased transfer of latent heat from the ocean to the atmosphere. In other words, we're transferring more heat from ocean to atmosphere during El Niño.
My question is how can the SST be expected to go up during El Niño when the latent heat flux out of the ocean is expected to be higher? Does that mean the conductive transfer of heat in from the atmosphere outweighs the increased advective latent heat flux out? I'm not a climate scientist, and I'm not doing the calculation right now, but I would usually predict that advective latent heat flux moves more heat than conduction. In addition, during El Niño, the higher evaporation leads to more cloud formation, which also reduces the radiant heat influx to the ocean. So, from my simplistic understanding, I see that during El Niño we have increased heat advective heat flux out of the ocean, and reduced radiant heat flux in to the ocean. So, I'm having a hard time seeing how El Niño would result in an increased global SST. I guess I would intuitively predict the opposite.
SST and latent heat fluxes
That's a good question, and I understand how this can be confusing. It's true that an increase in the latent heat flux out of the ocean should lead to cooling of the ocean surface, not a warming. It's important to recognize that in the main "action center" of El Nino in the tropical Pacific, the heating is driven by the transport of ocean heat through the "Bjerknes feedback," as described in this post. The cooling influence of the increased evaporation (as well as that of the cloud shading) is a negative feedback that offsets the warming, but it's not strong enough to overcome the warming influence the Bjerknes feedback. Outside of the main Pacific action center, there isn't a significant change in evaporation to compete with the atmospheric warming that spreads away from the central-eastern Pacific.
The farmer's dilemma
I have a farm in the highlands of Central Mexico and the impacts of ENSO on our drought-prone region are obviously very important, but also extremely unclear. I have been studying the historic charts for ENSO and it just isn't obvious how our rainfall is impacted. Right now El Niño is forecast to bring us drought. But it seems to me - and I am not at all a scientist - there are too many other factors to make a clear prognosis. This makes life very difficult to plan our farms. In our region, campesino farmers rely on the monsoon rains that start in May-June and run through October more or less. Right now, in June, we are having a drought. Hotter and drier, the monsoon rains are not in the forecast at all. We should be planting now but the ground is totally dry. But we are in a Neutral phase now, which in the past has not been a problem. So obviously there are other factors at play. I just wonder, with the climate being so complex, and climate change playing havoc with the whole system, if it is possible at all to really make helpful forecasts that allow farmers to prepare for their season.
compounding factors
I can empathize with the struggle you describe. Unfortunately, the ENSO signal doesn't always stand out among all competing factors, and often times those competing factors are more difficult to predict than ENSO months or seasons in advance. However, I still believe that the ENSO signal is strong enough to provide some guidance to farmers, as suggested in this blog post from a couple of years ago.
In addition to checking the charts related to past ENSO episodes, I might suggest checking some forecast maps from state-of-the-art seasonal forecast models, like from the NMME (one-month and three-month maps). As you can see from those links, you can get both spatial maps of anomalies (like for precipitation) and model skill, so you have an idea how reliable the models are. These forecasts can complement the ENSO-related guidance, so you could see if the models are consistent with expected ENSO impacts, if there may be some other signal that the models are seeing, or if the models are inconsistent/unskillful for the region, lead time, and variable of interest.
Add new comment