But what does a polar vortex breakdown look like down here?
We’ve talked about how the reversal of the west-to-east winds at 60 degrees North during a major sudden stratospheric warming sets up a feedback between large atmospheric waves and the winds, and how this results in the stratospheric wind changes being communicated down into the troposphere. But what does this mean for weather patterns down here after the polar vortex is disrupted?
By taking the average of the surface temperature and atmospheric thickness for the 30 days after all the major sudden stratospheric warmings in the observational record, we can average out day-to-day variations in the weather and see more clearly what weather patterns related to major warmings look like.
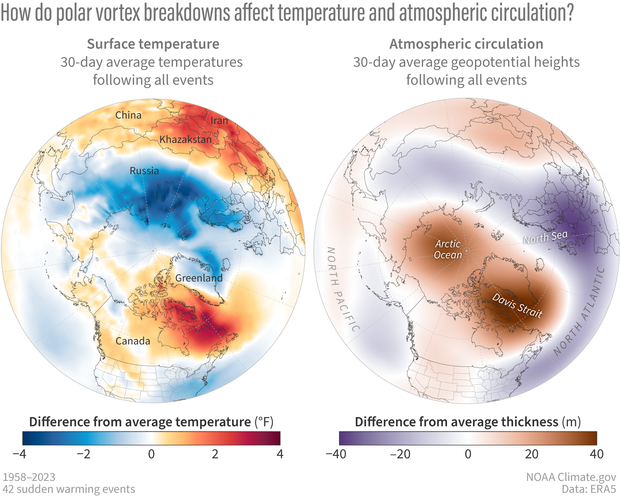
Average changes in (left) surface temperature and (right) atmospheric thickness (at the 500-hectoPascal pressure level) for the 30 days after the 42 observed major sudden stratospheric warmings from 1958-2023. NOAA Climate.gov image based on ERA5 reanalysis data provided by Amy Butler.
From a stratospheric hot mess to a tropospheric cold brew
Sudden stratospheric warmings (and sometimes just the phrase “polar vortex”) are often associated with cold and snowy weather; and indeed, anomalous cold is evident over some regions like northern Europe and Asia and the eastern United States after these events. How does a warming of the stratosphere cause widespread cold at the surface?
During major warmings, the atmospheric thickness increases over the pole, which shows up on these maps as a positive anomaly in tropospheric geopotential height over the Arctic, particularly Greenland. This increase in atmospheric thickness in the troposphere is linked to the build-up of air over the pole during the sudden warming: it can act like a rock dropped in a bucket, pushing down on the troposphere such that the cold Arctic air “sloshes” out into lower latitudes. An alternative way to think about it is that the increased atmospheric thickness over the Arctic induces changes in tropospheric winds that push cold air from the Arctic farther south in some regions and pull warm air from the south into the Arctic in other regions.
But… it’s not cold everywhere
Not all regions need to bring out snow shovels and gloves when a polar vortex breakdown is on the menu. The map shows that there are also large areas with generally warmer than normal surface temperatures after major warmings. These regions include eastern Canada and much of subtropical Africa and Asia. This is one reason why, even though we might care most about what happens where we live, we shouldn’t equate polar vortex disruptions with cold air outbreaks.
Weather effects are strongly regional
Another reason to not automatically assume that a major stratospheric warming means colder weather is that the magnitude of cold varies widely from place to place, with the strongest cold appearing over northern Europe and Asia, and more moderate to weak cold appearing over central Europe and the eastern United States. These regional differences arise because the changes in atmospheric thickness, and thus the effects on the tropospheric jet stream, are centered over the North Atlantic [footnote 1], and so the strongest associated temperature changes occur just upstream or downstream of this region.
An atmospheric gamble
It’s important to remember that the maps of "typical" surface impacts are not a forecast and do not represent the expected day-by-day weather when one of these events occurs. These maps show an average over many major warmings, each occurring in different years and with different global climate conditions (such as different phases of ENSO). These maps don’t give a sense of where the weather may vary substantially from one event to another.
Furthermore, they're also an average over the 30-day period after one of these events, which means that from day to day or week to week after a major warming event, the weather could look vastly different in any given location than from what is shown here. What this type of map does is provide a sense of where changes in temperatures and pressures are most likely to occur in the month after a major warming, allowing us to assess the probabilistic risk of certain extremes. In other words, a major warming “loads the dice” for certain conditions, but by no means guarantees them.
Another way we can get a hint about which areas are most likely to follow the average pattern is to look at how much variability there is at a given location from event to event. That's what the maps below show.
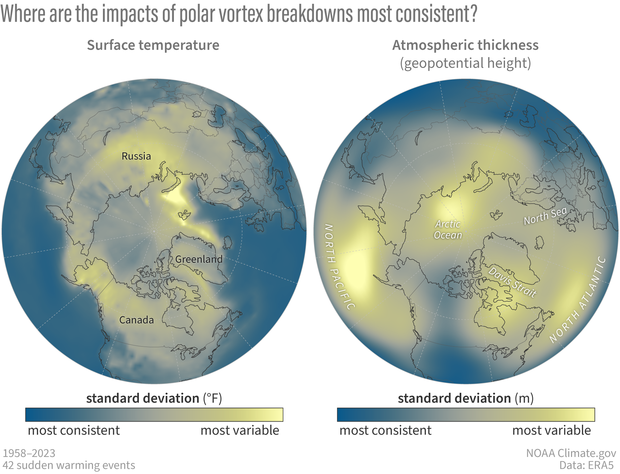
Where do the surface temperatures and atmospheric thickness (at the 500-hectoPascal pressure level) vary the most from one major warming event to another? These maps show where the standard deviation, a measure of the variability, is greatest across events (for the 30-day averaged period after the 42 observed major warmings in the 1958-2023 period). Surface temperatures (left) show high event-to-event variability across the central Arctic, Russia, and Alaska. The high variability over the central Arctic likely reflects changing sea ice conditions over this period. Atmospheric thickness (right) shows high event-to-event variability over Greenland and the North Atlantic, and the North Pacific. The high event-to-event variability over Alaska and the Pacific region likely reflects the varying El Nino-Southern Oscillation conditions that occurred during the 42 major warming events, which get averaged out in the first figure in this post. NOAA Climate.gov image based on ERA5 reanalysis data provided by Amy Butler.
Current polar vortex conditions: did it or didn’t it?
So did we see the second sudden stratospheric warming of the year? Well… it’s complicated. The stratospheric polar vortex did indeed rapidly weaken and warm as predicted, so physically-speaking, a sudden warming occurred around February 19, 2024.
However, whether it will be classified as a major or minor event is still unclear. This is because the way a major sudden warming is commonly defined [footnote 2] requires the daily-mean west-to-east winds, averaged around the 60N latitude circle and at the altitude corresponding to an atmospheric pressure of 10 mb, to fall below 0 m/s. In this case, the winds came very very close to that threshold (within +/- 1 m/s), so that some reanalysis data products [footnote 3] likely will show the winds falling below 0 m/s and others will not. This disagreement between data products has happened in the past and is one of the caveats of using a threshold-based definition of these events; there is some sensitivity to which events get “counted” as major warmings, even though a rapid weakening and warming of the polar vortex was observed.
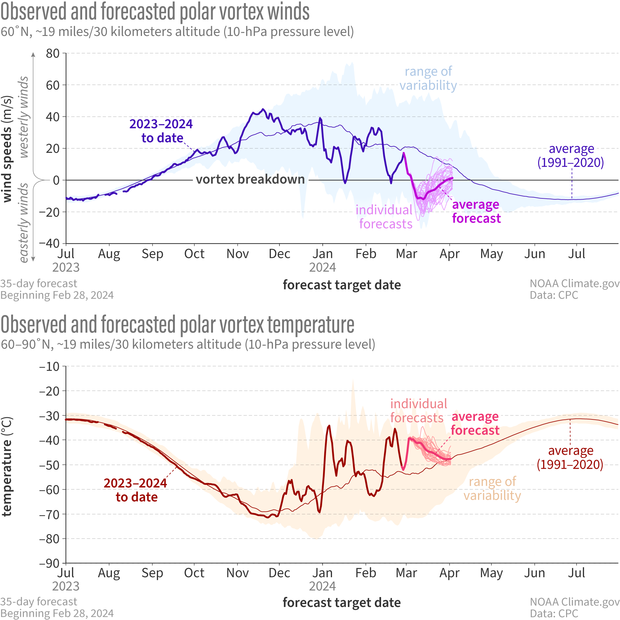
Observed and forecasted (NOAA GEFSv12) wind speed (top) and temperature (bottom) in the polar vortex compared to the natural range of variability (faint shading). For the GEFSv12 forecast issued on February 28, a reversal of the winds1 at 60 degrees North (the mean location of the polar vortex) is forecast to occur around March 5 (top, thick magenta line), accompanied by an increase in stratospheric temperature (bottom, thick pink line). While the winds only barely fell below 0 m/s in January and hovered near 0 m/s in February, in March the winds at 60 degrees North2 are expected to stay reversed until almost April. NOAA Climate.gov image, adapted from original by Laura Ciasto.
- Revised on April 26, 2024. The sentence originally said, "...a reversal of the vortex winds is forecast to occur...".
- Revised on April 26, 2024. The sentence originally said, "...the winds are expected to stay reversed...".
Nonetheless, perhaps because the weakening of the vortex wasn’t substantial enough to significantly reverse the stratospheric winds (if at all), the winds have re-strengthened quickly. The continued west-to-east winds will allow further onslaught of the polar vortex by atmospheric wave activity. [Remember from our earlier post that only when the polar vortex is whipping along from west-to-east can waves from below penetrate and disrupt it.] Current forecasts show potential for a more substantial reversal of the polar stratospheric circulation* than we’ve seen so far this entire winter taking place early next week. However, we are also heading into spring, which is when the stratospheric polar winds typically transition to an east-to-west summertime state. So it remains to be seen whether this upcoming reversal will essentially kill the polar vortex for the remainder of the season (the “final warming”), or whether the vortex will return in April for a brief period [footnote 4].
*Editor's note: Revised on April 26, 2024. This sentence originally said, "...a more substantial reversal of the stratospheric polar vortex*...". It's been revised to prevent confusion between the polar vortex as the average atmospheric flow of the polar stratosphere and as a specific manifestation of that circulation on a given day. For more context, read We're going to stop saying "polar vortex reversal".
Footnotes
- Why the North Atlantic jet stream appears more strongly affected than the Pacific region after major warmings is still not well understood.
- The most common definition is based on Charlton and Polvani (2007), but many other definitions exist. Which events are classified as “major” is sensitive to the definition used.
- Reanalysis products take multiple observational sources like satellite and balloon measurements and assimilate them into a model to create a product that is both temporally and spatially complete at each grid space of the model, and is constrained by observations. Because different data centers use different models and data assimilation techniques, and may assimilate different satellite and balloon records, reanalysis products can exhibit differences from one another. Note that because it can take some time for this data to be released, we often have to wait several weeks to determine if the major warming occurred in each dataset.
- There are more technicalities to the major stratospheric warming definition that have implications for the final count of events this winter. In particular, because events must be separated by 20 consecutive days of west-to-east stratospheric winds, this upcoming wind reversal will not be counted separately from the February 19th event, if it occurred. Additionally, if it is a final warming, it will not be counted as a major warming which only includes “mid-winter” events. Ultimately, these details are all somewhat arbitrary and only matter for statistical purposes!
Comments
Questions
This was an interesting post. That said, I had a couple of questions about it:
* What, exactly, is atmospheric thickness? It looks like an important concept when it comes to forecasting the effects of an SSW, but I'm not sure what it is.
2. Given how high up the stratospheric polar vortex is, how do you measure its strength and determine whether there has been an SSW? Weather balloons? Something else?
Thank you for reading this, and I look forward to hearing from you.
Thanks for your questions! 1…
Thanks for your questions!
1. Because the atmosphere is a gas, it expands when heated and contracts when cooled. This means that if we identify where the atmosphere is 500 millibars of pressure, for example, the location of that pressure will vary in altitude- in some places it will be higher above the surface (thicker), and in some places it will be lower (thinner). These regions generally correspond to regions of warmer and colder air temperatures, respectively. To summarize, by thickness, we are just referring to the altitude above the surface where the atmosphere is a given pressure.
2. Nowadays, we use reanalysis data. These products combine satellite and radiosonde (balloon) measurements but assimilate these into a model to fill in the data in space and time so there are no gaps. (see also footnote 3 of this post). However, the very first SSW that was observed in 1952 was indeed measured by balloon, from Berlin Germany.
Add new comment