A new NOAA tool is helping to predict U.S. droughts, global famine
This article was originally published on the Office of Oceanic and Atmospheric Research news page.
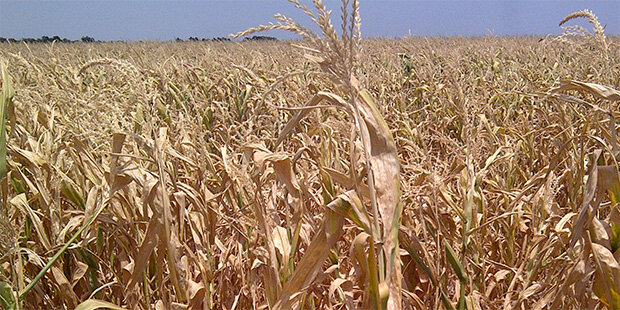
Drought withers a cornfield in Kansas. Image courtesy NOAA Oceanic & Atmospheric Research.
Agriculture is the economic engine that powers the Great Plains, the vast stretch of treeless prairie that covers parts of 10 states—and where the next drought can appear with little warning.
Now there’s a powerful new tool to help provide farmers and ranchers in the arid western United States critical early indications of oncoming droughts, and its name is EDDI.
EDDI, or the Evaporative Demand Drought Index, is the brainchild of Mike Hobbins, a CIRES scientist working at NOAA’s Boulder lab.
“Evaporative demand is the thirst of the atmosphere for any water: on the surface, in lakes and rivers, in the ground, or in plants,” Hobbins said. “Drought is a function of supply and demand. Surface moisture is really hard to measure because a major component is soil moisture, which varies dramatically over very short distances. Evaporative demand is relatively easy to measure because it’s based on air temperature, humidity, wind speed, and solar radiation, which we measure all the time.”
Proven in the field
Over the past few years, EDDI has steadily demonstrated its potential, accurately signaling the development of a 2015 drought in Wyoming and 2016 droughts in South Dakota’s Black Hills and the southeastern United States.
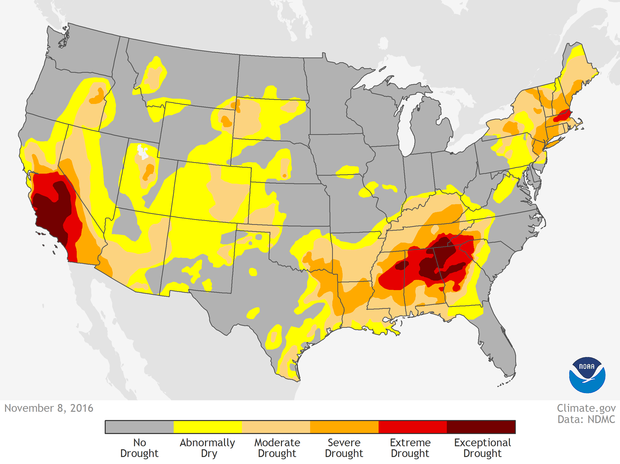
The EDDI tool gave an early signal that drought was likely to emerge in the U.S. Southeast in fall of 2016, helping to prove its value to scientists with the U.S. Drought Monitor project, which produces weekly maps like this one from November 8, 2016.
For Mark Svoboda, co-founder of the U.S. Drought Monitor, that was what he needed to see.
“Once I saw it work in both those situations, we ingested it into the operational stream,” said Svoboda, director of the National Drought Mitigation Center at the University of Nebraska. “What's unique about it is that it detects drought emergence at weekly time scales. This year, it gave us a pretty good indicator of what was happening in the Dakotas.” (The Dakotas and eastern Montana experienced a crippling “flash” drought in the summer of 2017.)
JUXTA HERE
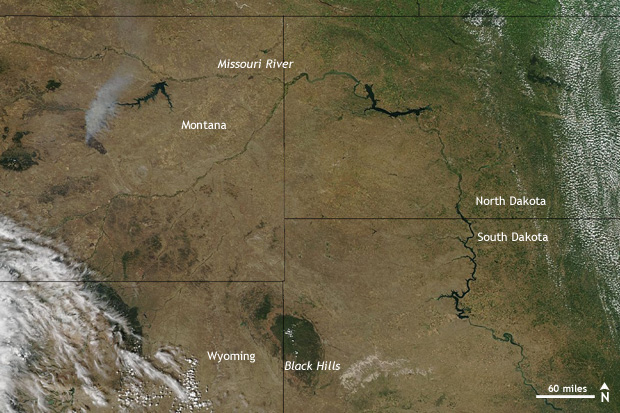
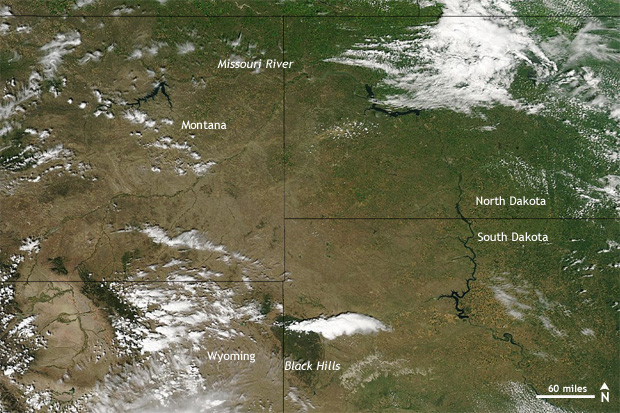
Click and hold to drag slider. The Northern Plains drought of summer 2017 was so severe that its impact on crop and pasture were easy to see even in photo-like satellite images. On July 23 (left), much of the plains west of the Missouri River were shades of tan and brown. In the previous summer (right) on July 19, the plains have a wash of green vegetation. NASA satellite images. larger versions 2017 | 2016
EDDI is now one of four or five dozen parameters that are evaluated by Drought Monitor authors before they produce the weekly drought maps.
The weekly drought map, a collaboration of the U.S. Department of Agriculture, the National Drought Mitigation Center at the University of Nebraska-Lincoln, the U.S. Department of Commerce and NOAA, is a vital resource for dryland and irrigated farm operators, ranchers, water managers and many others.
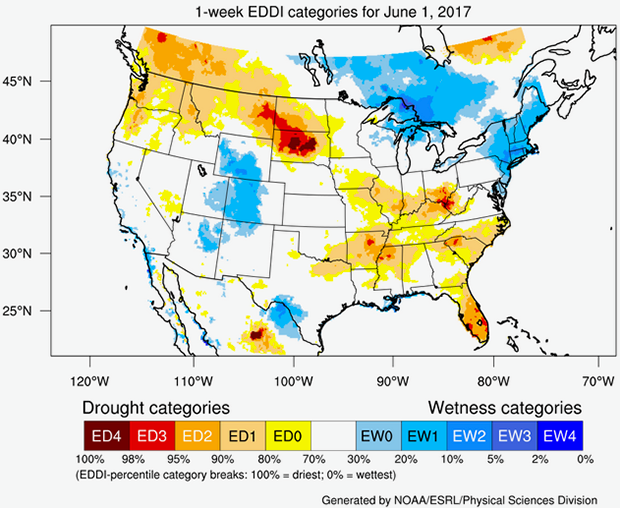
This map of Evaporative Demand Drought Index values across the U.S. for the 30 days prior to June 1 shows the relative "thirst" of the atmosphere in the northern Great Plains as a severe drought began to take hold. Image courtesy NOAA Oceanic & Atmospheric Research.
Brad Rippey, a meteorologist with the US Department of Agriculture’s Office of the Chief Economist and one of several drought map authors, said EDDI really demonstrated its worth across the northern Plains in 2017.
“Things started drying out in early spring and I wasn’t looking carefully at it at that point,” Rippey said. “When we got to June and July, things started to happen fast: crop conditions were tanking, we started seeing a lot of heat – EDDI was pretty much all over it at that point.”
Helping to identify areas at risk of famine
EDDI is hard at work abroad as well. The U.S Famine Early Warning System network, which helps governments and relief agencies plan for and respond to humanitarian crises, has also begun using EDDI to help provide early warning of food insecurity ( limited access to sufficient food supply) around the world.
A case study over parts of East Africa shows that a combination of forecasts for both evaporative demand—“atmospheric thirst”—and precipitation would have provided early warning of severe droughts in 2002, 2004 and 2009 that contributed to substantial food shortages in the region.
"All else being equal, a warmer atmosphere is a thirstier atmosphere,” said Hobbins. “It’s likely we’ll see more frequent droughts in the future, and EDDI is uniquely designed to capture their emergence.”
Learn more about EDDI here: https://www.esrl.noaa.gov/psd/eddi/