Climate highlights of 2023
This year was a busy year for our team at Climate.gov providing updated maps, graphs, stories, and deeper explanations of our planet’s changing climate. There were many weather and climate events across the globe from extreme rainfall, to record warmth, and a major ENSO transition (just to name a few). So, before 2023 officially wraps up we want to highlight some of the stories, maps, and graphs that we brought you this year.
Extreme rainfall
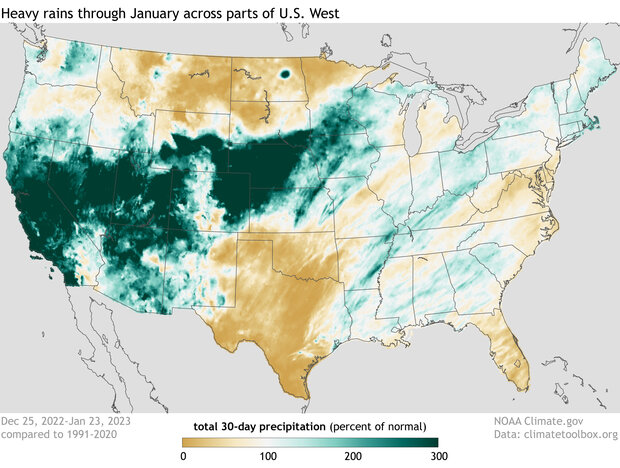
Percent of normal U.S. precipitation over the past 30 days (December 25, 2022, through January 23, 2023) after a series of weather events known as atmospheric rivers, fueled by tropical moisture, flooded the U.S. West with rain and snow. Places where precipitation was less than 100 percent of the 1991-2020 average are brown; places where precipitation was 300 percent or more than average are blue-green. NOAA Climate.gov image, based on analysis and data provided by the Climate Mapper website.
Where best to start than in January? A series of NINE atmospheric rivers in the first few weeks of the year dropped FEET of rain and snow across California and other parts of the West Coast. This series of events significantly improved drought conditions across a large chunk of the western United States and provided California with 80 percent of their average seasonal snowpack. To date, the drought across the West has improved for many locations and California remains drought-free, according to the U.S. Drought Monitor. California gets another honorable mention this year, when former Hurricane Hilary in August caused the National Hurricane Center to issue its first ever tropical storm watch (and later warning) for the state.
Polar vortex
The seasonal cycle of polar vortex temperatures (background maps) and winds (white arrows). NOAA Climate.gov animation, based on Climate Forecast System Reanalysis data provided by Laura Ciasto.
Moving on to February, the polar vortex once again began making headlines following a sudden stratospheric warming event. This topic was so popular among our readers, it spawned the creation of our seasonal (December through March) Polar Vortex Blog, which kicked off just a few weeks ago with this first posting. The experts in the latest post hint that another warming event may be possible in January 2024. Be sure to bookmark our Polar Vortex Blog to follow along with what the polar vortex could bring us this winter season.
ENSO transition
Weekly surface temperatures in the tropical Pacific Ocean compared to the long-term average from December 5, 2022, to May 14, 2023. Week by week, the cooler-than-average waters (blue) of the La Niña climate pattern fade, and the warmer-than-average waters that (orange and red) signal a possible El Niño emerge. NOAA Climate.gov image, based on CoralReef Watch data processed by NOAA Viz Lab.
In March we said “goodbye” to La Niña and in June we officially said “hello” to El Niño. Since June we have answered several of your burning questions…
- How does El Niño affect snowfall over North America?
- What are El Niño’s impacts on the Northern Hemisphere?
- And, has climate change already affected ENSO?
One thing is certain, El Niño is here and there is more than a 50% chance that it will end up “historically strong,” potentially ranking in the top 5 on record. Our experts will continue to monitor this year’s El Niño and bring twice monthly updates through our ENSO Blog.
Record warmth
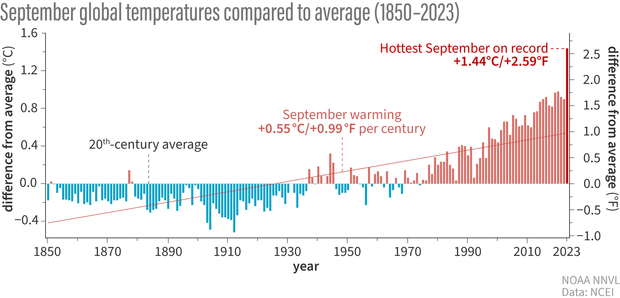
September temperature compared to the 20th-century average from 1850 to 2023. Septembers have grown warmer at a rate of nearly 1 degree Fahrenheit (0.6 degrees Celsius) per century over the modern temperature record. NOAA Climate.gov graph, based on data from NOAA National Centers for Environmental Information.
There is an all but certain chance (greater than 99%) that 2023 will rank as Earth’s warmest year on record according to NOAA’s long-term record. The oceans experienced record high temperatures globally for many months, which lead to a historic heat wave and widespread coral bleaching throughout the Florida Keys. Antarctic sea ice experienced a record-low summer minimum AND record-low winter maximum this year. Meanwhile, the Arctic experienced a record-warm summer which contributed to the continued decline of sea ice across the region, according to this year’s Arctic Report Card. Several heat waves impacted the United States this summer bringing life-threatening conditions to Puerto Rico, prolonged triple-digit heat to Texas in June, and record temperatures to portions of the Southwest in July.
Greenhouse gas emissions
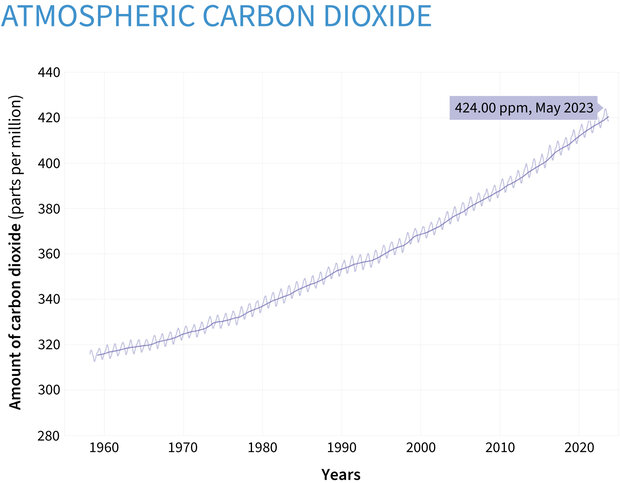
The modern record of atmospheric carbon dioxide levels began with observations recorded at Mauna Loa Observatory in Hawaii. This graph shows the station's monthly average carbon dioxide measurements since 1958 in parts per million (ppm). The seasonal cycle of highs and lows (small peaks and valleys) is driven by Northern Hemisphere summer vegetation growth, which reduces atmospheric carbon dioxide, and winter decay, which increases it. The long-term trend of rising carbon dioxide levels is driven by human activities. At Mauna Loa, the highest monthly value each year occurs in May. In May 2023, carbon dioxide hit 424 ppm—a new record. NOAA Climate.gov image, based on Mauna Loa monthly mean data from NOAA Global Monitoring Lab.
And finally, increasing greenhouse gas emissions (including carbon dioxide) have continued to be a hot button item this year. According to the Global Carbon Budget report, there is an urgent need to significantly reduce emissions to meet global climate targets and avoid severe and deleterious effects of climate change. Carbon dioxide peaked at 424 parts per million in May at NOAA’s Mauna Loa Atmospheric Baseline Observatory, which is more than 50% higher than before the industrial era. We wrote about the importance of reducing our carbon dioxide emissions, even if other countries don’t do the same and explained why, if carbon dioxide hits a new high every year, isn’t every year hotter than the last. You can track the rise of carbon dioxide and greenhouse gases on our Global Climate Dashboard.
It is our mission to bring you all scientific data and information about climate science, adaptation, and mitigation in order to further understanding about our climate and promote a climate-smart nation. Our team is very passionate about what we do, and we look forward to bringing you more content in 2024!
Be sure to bookmark our homepage and follow us on Twitter, Facebook, and Instagram.