What's in a number? The meaning of the 1.5-C climate threshold
Numbers and the meanings we attach to them can be weird. A number can mean a lot or very little depending on how it is being used, and who is using it. To a Taylor Swift fan, 13 is a lucky number. To many in Western cultures, it is a day of bad luck when falling on a Friday. To others, 13 is just the number that comes after 12. When it comes to climate science and policy, one of our “13s” is the 1.5°C climate threshold, shorthand for global average surface warming of 1.5 degrees Celsius above pre-industrial temperatures. That’s the level of warming that the countries who signed the Paris Agreement have agreed to try to stay below. But what does pre-industrial mean? How do we know when we’ve passed 1.5°C? And what happens if we do?
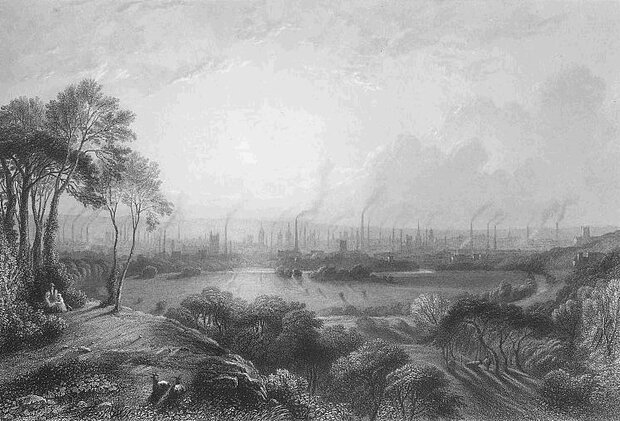
The Industrial Revolution transformed the textile industry in England. This engraving by Edward Goodall (1795-1870), originally titled "Manchester, from Kersal Moor," after a painting of W. Wylde, shows numerous industrial chimneys in the town of Manchester, England, which earned the nickname "Cottonopolis," following its transformation. Image in the public domain, from Wikimedia.
Defining pre-industrial average
When you read or hear climate numbers, they are often being compared to average. The September 2023 NOAA global surface temperatures, for instance, were 1.44 degrees Celsius above average. That average represents a defined period of time. In this case, September was 1.44°C warmer than the average September of the twentieth century.
For the 1.5°C climate threshold, the “average” time range is defined as the “pre-industrial period”, or the period of time before the increase in atmospheric greenhouse gases due to human-emissions began to significantly influence global temperatures. Sounds a bit vague, right? What years make up this “pre-industrial period?” It depends.
Most history books define the dates of the Industrial Revolution as between the mid-1700s and mid-1800s, but scientific definitions of pre-industrial typically cover some range of decades between 1850 and 1900. Why? Because that’s the earliest time period with widespread, consistent surface temperature records. Different research groups use different parts of the broader time range. For NOAA data, we currently define pre-industrial as 1850-1900. (Footnote 1)
While there can be differences in what counts as “pre-industrial”, it's important to remember that industrial versus pre-industrial is really about the human signature on our climate and how scientists can distinguish that from natural variability going back thousands of years. (Footnote 2)
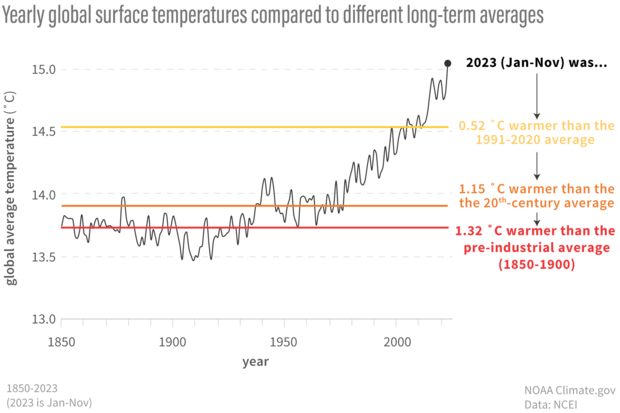
How far the global temperature is above average depends on how you define average. For NOAA's global temperature dataset, "pre-industrial" is defined as the period from 1850-1900. For routine monthly reports, NOAA compares monthly temperatures to the 20th-century average. NOAA Climate.gov graph, based on data from NCEI.
Defining surface temperature
Adding to the nuance, global surface temperature itself can potentially refer to different temperature variables measured in different ways. On land, thermometer-measured temperature variables can include readings at both at the literal ground surface and at two meters above. Over water, ships and buoys can measure the surface ocean temperature directly as well as the air temperature two meters above the water. From high above, satellites don’t directly measure temperatures, but scientists derive land surface and atmospheric temperatures based on the amount of thermal and microwave energy satellites receive.
Suffice to say, there are a lot of ways of measuring temperatures. And THEN there are different ways of combining those observations into a global dataset. (Despite these differences, all major temperature records show a similar long-term warming trend.) When NOAA releases the latest monthly climate statistics, it uses the NOAA Global Surface Temperature (NOAAGlobalTemp) dataset which blends in-ocean sea surface temperatures and 2-meter air temperatures.
So, when you come across stories about the 1.5°C threshold—especially if you think you’re seeing contradictory stories about whether we have or haven’t reached 1.5°C— you should ask yourself three questions. 1) What is the dataset? 2) What is the “pre-industrial” time period? 3) What kind of temperature is being used? Those are the details you need to be able to put that story into context and compare it to other sources of information.
Where did this number come from and how is it used in international diplomacy?
Let’s go back in time before large international climate conferences like COP28 existed. In the 1970s and 1980s, as climate science was evolving and our understanding of the impacts that human activities were having on greenhouse gas emissions, scientists were using different temperature thresholds to understand the potential impacts of these emissions (Nordhaus 1975). These thresholds usually ranged from 1-2°C.
As the international community has come together to address climate change, it became important to have an agreed upon temperature target as a catalyst for climate action When the first international climate treaty was negotiated in 1992, Parties agreed to stabilize “greenhouse gas concentrations in the atmosphere at a level that would prevent dangerous anthropogenic interference with the climate system.” In 2010, the Cancun Agreement further recognized the need “to hold the increase in global average temperature below 2°C above preindustrial levels”.
However, research continued to show that for some countries and vulnerable ecosystems, the risk of grave damage rapidly increases at less than 2°C of warming. So in 2015, nearly the entire world (195 nations) came together at the United Nations-held international climate meeting COP21 to sign the Paris Agreement. This landmark treaty explicitly states that the world’s nations pledged to “hold the increase in the global average temperature to well below 2°C above pre-industrial levels and pursue efforts to limit the temperature increase to 1.5°C above pre-industrial levels,” recognizing that this would significantly reduce the risks and impacts of climate change.
The relevance of this temperature threshold was explored even more in the 2018 IPCC Special Report on Global Warming of 1.5°C. In that report, and further supported by subsequent IPCC reports and other scientific literature, they found that limiting global warming to 1.5°C will reduce the impacts on human systems and terrestrial, freshwater and coastal ecosystems. It made clear that every increment of global warming above 1.5°C matters for the scope and magnitude of these impacts.
When do we know we’ve passed it?
Remember, passing this threshold as defined in the Paris Agreement is supposed to reflect when human-caused global warming consistently exceeds 1.5°C compared to pre-industrial times. That is NOT simply when average global temperatures pass that mark on any given day, month, or even year. To know when Earth has passed that threshold, we have to look at longer timescales.
Why? Let’s look at a recent example. Global surface temperatures in September, October, and November 2023 exceeded 1.5°C above the pre-industrial period. Does that mean the Paris Agreement has failed? No! Global surface temperatures can be influenced not only by human-caused climate change, but also by natural climate factors like El Niño and random weather. When combined, these factors can briefly push monthly or even yearly global temperatures above 1.5°C; that doesn’t mean 1.5°C is the new normal.
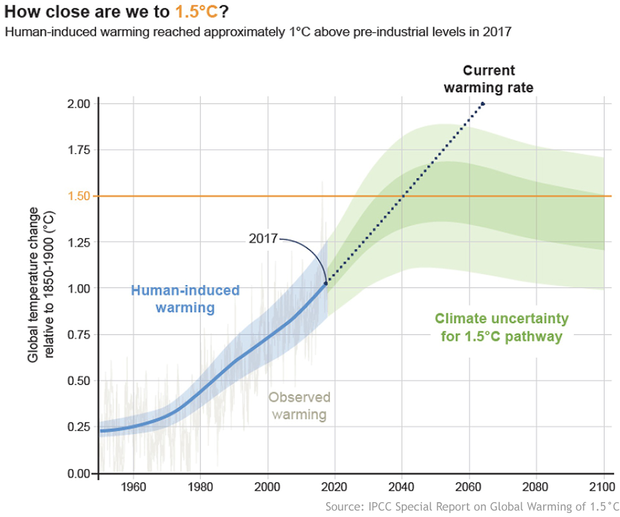
Human-induced warming (blue shading) reached approximately 1°C above pre-industrial levels in 2017. At the present rate, global temperatures would reach 1.5°C around 2040. Stylized 1.5°C pathway shown here (green shading) involves emission reductions beginning immediately, and CO2 emissions reaching zero by 2055. Graphic appears in FAQ 1.2 in the Frequently Asked Questions supplement to the IPCC Special Report on Global Warming of 1.5°C.
Instead, we need to average the temperature anomalies over a period of time like 20 to 30 years. Averaging helps to smooth away any of the rough edges caused by natural warming factors and better reveals the long-term trend. That is why it can be said at the same time that global temperatures have reached 1.1°C above the pre-industrial in 2011-2020 (according to the IPCC 6th assessment report), and that global temperatures in September 2023 were 1.5C above the pre-industrial.
It's also important to note that the Paris Agreement does not specify how many years should make up this long-term trend, which dataset should be used, and which time period makes up the pre-industrial period. That means different scientists, governments and groups might come to different conclusions about when Earth passes this critical threshold.
Do impacts start at 1.5°C of warming?
Absolutely not. Millions of people globally are already experiencing impacts of climate change in the form of extreme temperatures, heavy rains, flooding, and more. The 1.5°C climate threshold is not a light switch that turns on all sorts of climate calamities. For every little bit of additional warming, the risk of negative impacts gets worse.
So why did the Paris Agreement define the global temperature target of 1.5°C? Because both models and paleoclimate data show that beyond 1.5°C, the risk of severe impacts to some ecosystems and locations—including places where people are least responsible for the problem—become larger than the world as a whole was willing to accept. Urgent action in this decade is essential for trying to minimize these impacts.
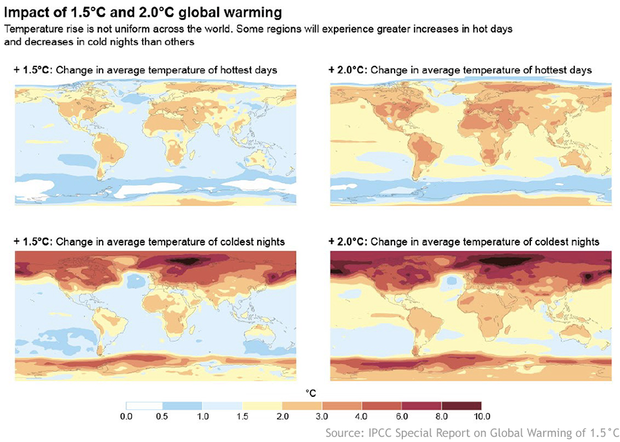
Temperature change is not uniform across the globe. Projected changes are shown for the average temperature of the annual hottest day (top) and the annual coldest night (bottom) with 1.5°C of global warming (left) and 2°C of global warming (right) compared to pre-industrial levels. Graphic appears in FAQ 3.1 in the Frequently Asked Questions supplement to the IPCC Special Report on Global Warming of 1.5°C.
The 1.5°C limit is sort of like a highway speed limit. Backed by plenty of science about the dangers of speeding, we know that every bit of additional speed increases the danger of an accident. There is no single speed below which the risks are zero and above which (within reason) an accident is guaranteed to occur or to be deadly. Still, we pick a limit beyond which the risks become larger than we are willing to tolerate. (Footnote 3)
Our best bet as drivers and human beings affecting the climate is to not push our luck, especially when some of consequences—societal, economic, or ecological—could be dire.
What’s the near-term seasonal forecast?
Looking at what models predict for the near term (next 9 months), monthly global temperatures look to remain quite warm through the beginning of 2024 before beginning to fall from that perch as the calendar shifts into spring. This is consistent with how we know El Niño impacts global temperatures; this period coincides with the forecasted weakening of the current El Niño. (Footnote 4)
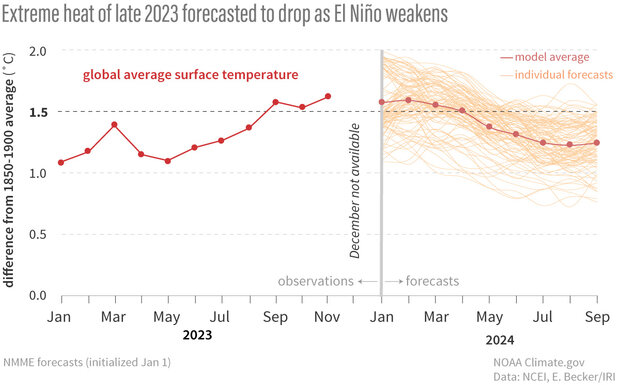
Monthly average temperatures (red dots and line) rose to more than 1.5 degrees Celsius above the pre-industrial average in late 2023. On average, forecasts from the North American Multi-model Ensemble (NMME) system indicate temperatures are likely to decline a bit—though remaining quite warm from a historical perspective—as the strong Niño currently underway begins to fade in early 2024. NOAA Climate.gov graph based on data from NCEI and Emily Becker/IRI.
What’s the medium-term, multi-year forecast?
In May 2023, the World Meteorological Organization forecasted that annual global temperatures were predicted to have a 66% chance of exceeding 1.5°C for at least 1 year between 2023-2027 (Footnote 2). This is consistent with how we expect continued global warming to affect temperature trends over multi-year time periods and the likelihood for a strong El Niño to supercharge warming in a given year.
So when will we really reach 1.5°C? According to the 6th Assessment Report: “In the considered scenarios and modeled pathways, the best estimates of the time when the level of global warming of 1.5°C is reached lie in the near term (2021-2040).” And global warming is more likely than not to reach 1.5°C even under the very low greenhouse gas emission scenarios. That means we not only have no time to lose in reaching net zero greenhouse gas emissions, but that we should also be thinking about how to make the things that matter to us, from our communities to our natural resources, better able to withstand—at the very least—that level of warming.
Footnote
1) Before 2023, NOAA used 1880-1900. Once NOAA’s dataset was extended back to 1850, so did the pre-industrial time period.
2) Paleorecords help us extend even farther back which is one way in determining just how much current warming differs from natural patterns.
3) This monthly global surface temperature forecast was provided by Emily Becker and comes from the North American multi-model ensemble (NMME) model members that were available on January 8. To learn more about the NMME, head to this post at the ENSO Blog.
4) NOAA contributes to the WMO international decadal prediction program through the UK Met Office. Decadal predictions made with the Seamless System for Prediction and Earth System Research (SPEAR) are provided annually to this effort.