U.S. climate outlook for April 2024
Spring began as winter ended in the eastern half of the United States, with well above normal temperatures and a wetter-than-average East and South and a drier-than-average Midwest. The western half of the nation did see colder weather and a few snowstorms, but as we head into April, thoughts turn to warmer weather for most. Rainfall becomes more important across the farmlands of the Midwest, where persistent drought has dominated the western Corn Belt. Will April showers bring May flowers and improve drought conditions as farmers get out to plant their crops? Does winter have a last punch left in its arsenal? Let’s see what NOAA’s Climate Prediction Center (CPC) has to say about April.
The U.S. temperature outlook for April 2024, showing where the average temperature is favored to be much warmer than average (orange and red). Darker colors mean higher chances, not higher temperatures. White areas mean that there are equal chances for a warm, cool, or near-average April. Much warmer or much cooler than average means "in the upper or lower third" of April temperatures from 1991-2020. For more details on how to interpret these maps, read our explainer Understanding NOAA's monthly climate outlooks.
On March 31, CPC released its updated monthly climate outlooks for temperature, precipitation, and drought across the United States for April 2024. The temperature outlook favors well above normal temperatures across much of the northern and central parts of the nation, with well below average temperatures not favored in any locations. The precipitation outlook favors well above average precipitation (rain and/or snow) across large parts of the western, central, and eastern parts of the country, with well below average precipitation only favored in parts of the Pacific Northwest and northern Maine.
The precipitation outlook for April 2024, showing where the monthly precipitation (rain and snow) is favored to be much higher than average (greens) or much lower than average (browns). Darker colors mean higher chances, not more extreme precipitation departures. White areas mean that there are equal chances for a wet, dry, or near-average April. Much higher or much lower than average means "in the upper or lower third" of April precipitation amounts from 1991-2020. For more details on how to interpret these maps, read our explainer Understanding NOAA's monthly climate outlooks.
More detail about the outlooks and their basis can be found below. I’ll also discuss the current state of drought, how it changed during March, and how CPC expects drought to change during April. Finally, my ever-present reminder that the colors on the temperature and precipitation outlook maps only provide information about the most likely outcome, but other outcomes are still possible, although less likely to occur. More details about interpreting the outlooks can be found here.
The updated outlooks were produced considering the Week 1 forecast from the Weather Prediction Center (WPC), and CPC’s own Week 2 and Week 3-4 outlooks. Other tools that forecasters examined this month were longer-range forecast models such as the Global Ensemble Forecast System (GEFS), the Climate Forecast System (CFSv2), and products derived from these models. El Niño began what is expected to be a rapid transition to ENSO-neutral during March, but the fading climate pattern may still impact the global climate during April. Therefore, it was again considered as a factor for the April outlooks. Observed soil moisture was also considered for this outlook, as extremes in soil moisture (both wet or dry) can influence temperatures during the spring and summer.
Temperature outlook leans warm
The April temperature outlook favors well above average temperatures across the entire northern tier of the country, from the Pacific Northwest and northern California eastward across the northern Rockies and Plains, to the Great Lakes and into the Northeast and mid-Atlantic. Above-average temperatures are also favored in the Central and Southern Plains and in the Ohio and Tennessee Valleys. The region most likely to be warmer than average extends from the northern Great Plains to Michigan, exceeding 50%. No areas are favored to be colder than average, and there is no tilt in the odds towards any climate outcome in much of the West, from central and southern California to Colorado and West Texas, and in the Southeast.
The widespread area favored to experience above-normal temperatures represents a subjective compromise between the various temperature outlooks for different segments of the month. They generally all tilt toward above-average warmth in the Northern Plains and Great Lakes regions, but are not as consistent in the West and Northeast. In addition, the weaker tilt in the odds towards above-normal temperatures along the Northeast and Upper Mid-Atlantic coast is due to anticipated tempering effects of soil moisture, which currently exceeds the 95th historical percentile.
Precipitation outlook leans wet
Well above average precipitation is again favored across large parts of the nation during April, in areas stretching from parts of the Southwest eastward across the central and southern Great Plains and from the Gulf Coast extending up the Eastern Seaboard to southern New England, with the exception of the Carolinas, where there is no tilt in the odds towards any category (“Equal Chances” or EC).
Probabilities for a wet April are highest in parts of the Ohio Valley from eastern Illinois to western Pennsylvania (exceeding 50%). This region is predicted to have 2-4 inches of rainfall during the first week of the month, with above-average rainfall also favored in CPC’s Week-2 outlook. Precipitation is favored to be above-normal across the central and southern Plains in CPC’s Week-2 and Week 3-4 outlooks, with very high odds across South Texas in Week-2 (exceeding 70%). Rainfall is also favored to be above average in all outlooks across the Southwest, an area that is often wetter than average during the final stages of strong El Niño episodes.
Well below average precipitation is favored over much of the northern and central Pacific Coast states, as CPC’s outlooks all tilt toward below average in this region. The small area of relative dryness over northern Maine has very low odds for below because it is a mix of influences. It’s not too far removed from the axis extending into southern New England where above-average precipitation is favored. However, below-average precipitation is favored during the first 2 weeks of the month.
Drought area down by half since start of winter
After a wet winter and early spring across much of the country, drought across the continuous United States had decreased to around 18% by the end of March, down from 20% at the end of February, and from about 36% at the beginning of winter. This is the least amount of drought across the country since May 2020. Additionally, the percent of the country in the two most intense categories (D3-D4, representing extreme and exceptional drought) was only about 1% at the end of March, also the lowest amount since May 2020.
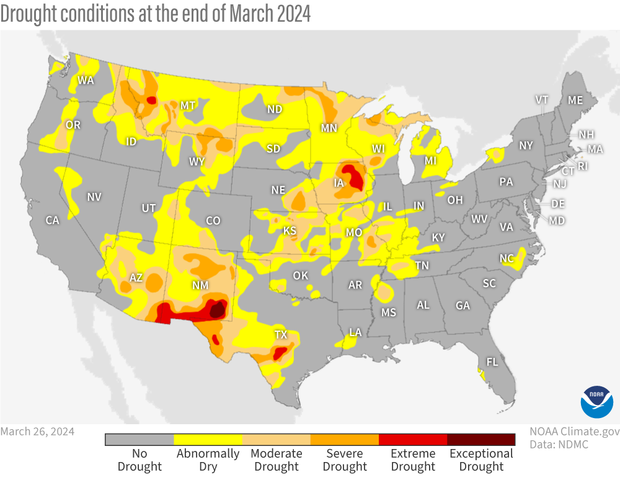
Drought conditions across the contiguous United States as of march 26, 2024. Extreme (red) and exceptional (dark red) drought was present in relatively small parts of the Southwest and central Great Plains. Map by NOAA Climate.gov, based on data provided by the U.S. Drought Monitor project.
Regionally, drought changes were almost all on the order of one class during March. The only exceptions to that occurred in the middle of the country, where 2-class degradation occurred in small parts of Kansas and Oklahoma, and 2-class improvements were noted in Missouri, Tennessee, Louisiana, Mississippi, and North Carolina. The 2-class improvements generally resulted in drought removal, while the 2-class degradation only resulted in moderate drought, as those areas were not in drought at the beginning of the month.
Drought outlook has good news for Corn Belt
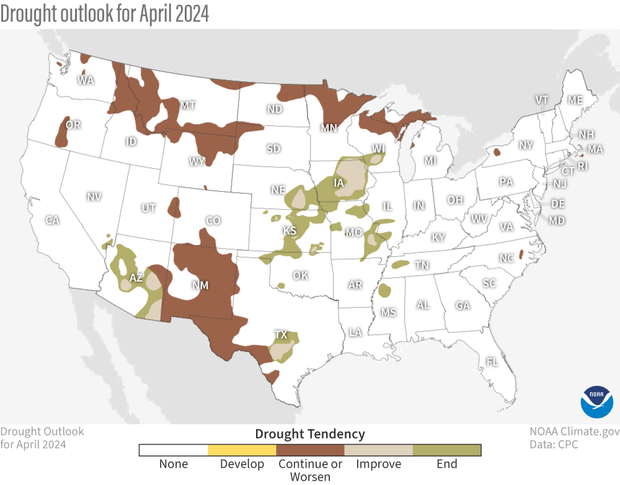
U.S. map of predicted drought changes or persistence in April 2024. No new drought was forecasted to develop, and drought improvement and removal is likely across the central Great Plains. NOAA Climate.gov map, based on data from the Climate Prediction Center.
With drought affecting less area of the country than in recent years, the drought outlook for April also has less coverage, with a mix of drought persistence and improvement and no regions predicted to develop drought. With equal chances for above-, below-, or near-average precipitation forecast for the northern part of the nation from the Great Lakes westward, drought currently in areas across the northern Rockies and western Great Lakes is expected to persist. The Southwest is more of a mixed bag, with those regions favored to be wetter than average in Arizona and central Texas likely to see drought improvement (or even removal), but with the regions in New Mexico and West Texas that are in drought expected to persist. Finally, drought is expected to improve (with some removal) across the Central Plains and western Corn Belt, with wetter-than-normal conditions favored in the monthly outlook (as well as in CPC’s Week-2 outlook), certainly good news for agricultural concerns in this region.
To read the entire discussion of the monthly climate outlooks from the Climate Prediction Center, check out their website.