How tree rings tell time and climate history
Most of us learned as children that the age of a tree could be found by counting its rings. Rings of trees growing in temperate climates can indeed tell their age through their annual rings and also help determine the age of wood used to construct buildings or wooden objects. The ages of wooden objects can be revealed by cross-dating, the process of matching ring patterns between wood samples of known and unknown ages.
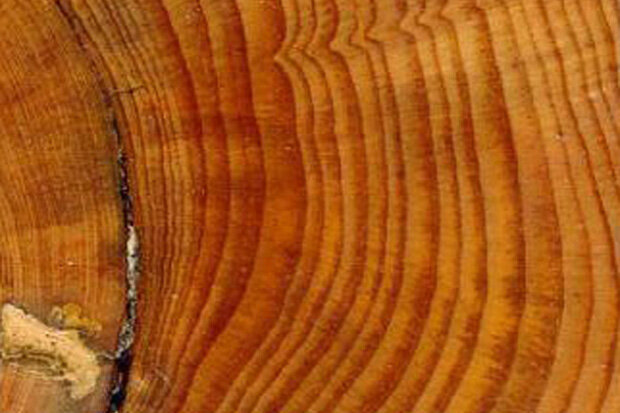
Concentric rings of various widths mark the annual growth of trees. Photo by Peter Brown, Rocky Mountain Tree-Ring Research.
What do tree rings tell us
The underlying patterns of wide or narrow rings record the year-to-year fluctuations in the growth of trees. The patterns, therefore, often contain a weather history at the location the tree grew, in addition to its age. In dry environments, such as the Middle East or U.S. Southwest, tree rings typically record wet or dry years, and in cooler areas (high latitudes or high elevation), the ring widths are often a proxy for temperature.
Archeologists have used the ring patterns in building timbers to estimate construction dates for some of the world’s most famous buildings, including the cliff dwellings at Mesa Verde National Park (nearly 1,000 years old) and the Church of the Nativity in Bethlehem (nearly 1,500 years old).
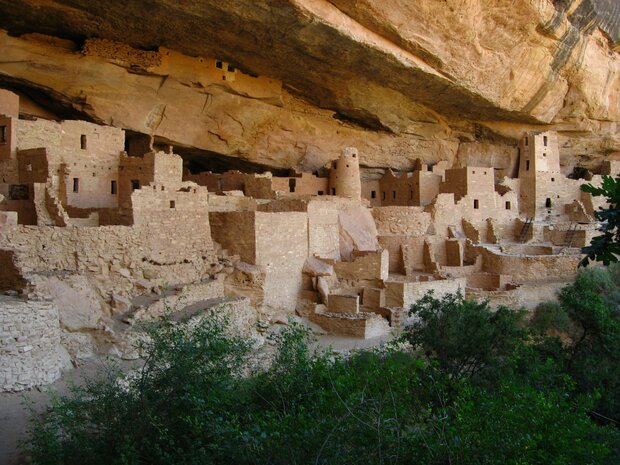
The Cliff Palace ruins at Mesa Verde were built in the 1200s by the Ancestral Pueblo people, but were abandoned in the late part of the century. Photo by Ken Lund, used under a Creative Commons license.
What's in NOAA's tree ring data base?
NOAA National Centers for Environmental Information (NCEI) houses the International Tree-Ring Data Bank (ITRDB), which contains ring width data from forests worldwide, plus ring width data from old buildings, and even from rare Stradivari violins. The ITRDB contains ring width data from trees at over 4,600 locations on six continents, providing tree growth histories from around the world. New additions from field scientists are added regularly.
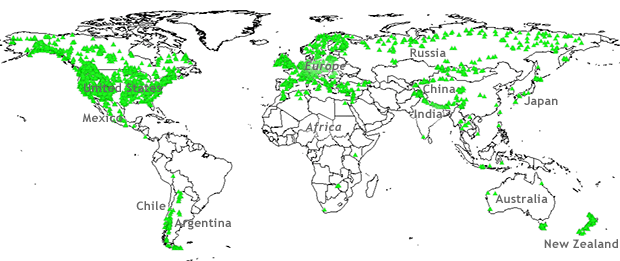
The ring patterns of more than 6,000 trees (green triangles) have been archived in NOAA's International Tree-Ring Data Bank.
Climate scientists compare the tree growth records to local weather records. For locations where a good statistical match exists between tree growth and temperature or precipitation during the period of overlap, the ring widths can be used to estimate past temperature or precipitation over the lifetime of the tree.
In many parts of the world, trees can provide a climate history for hundreds of years, with some extending back 1,000 years or more. The resulting climate histories enhance our knowledge of natural climate variability and also create a baseline against which human-induced climate change can be evaluated. NCEI archives these climate reconstructions in addition to the tree ring measurements.
Glimpsing the past
Tree ring data have been used to reconstruct drought or temperature in North America and Europe over the past 2,000 years. For example, tree ring based drought reconstructions for the American Southwest indicate a period of prolonged drought in the late 1200’s. Archeologists believe that the drought was a contributing factor in the Ancestral Pueblo People abandoning the famous cliff dwellings at Mesa Verde, never to return.
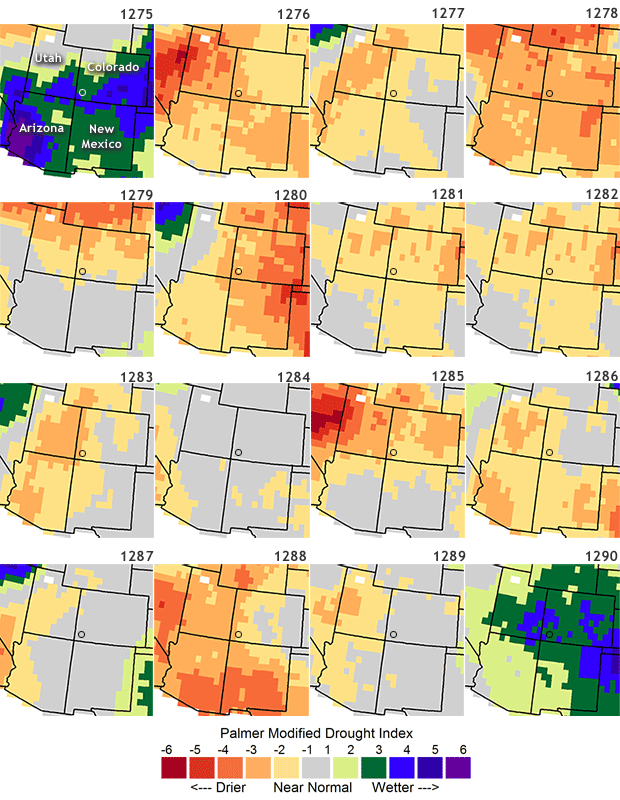
Severe drought in the U.S. Southwest in the late 1200s likely contributed to the abandonment of Mesa Verde (marked with open circle) by the Ancestral Pueblo people. Drought maps for the years 1275-1290 reconstructed from tree ring records show that over the 16-year span from 1275-1290, only two wet years occurred. Graphic by Climate.gov, based on summer drought reconstructions from the Living Blended Drought Atlas, courtesy of NOAA and Cook et al., 2010, Journal of Quaternary Science, 25(1), 48-61. doi: 10.1002/jqs.1303.
Comments
tree rings
RE: tree rings
RE: RE: tree rings
RE: tree Rings
"The resulting reconstructions are validated with rigorous statistical analysis, and not used unless statistically valid. There has never been any manipulation of data to skew results.
It is hard to say Tree Ring data is both curated for validity and say there "has never been any manipulation of data" at the same time.
Is the complete data set preserved (all data accepted and data rejection alike) in these data sets? Otherwise, your assertion is hard to justify.
We know that some tree ring data was purposely tossed, wihere some of which was only by chance recovered when one of the authors died, and his data from his estate was published by his university.
tree rings
What is your source?
re: What is your source?
I'm not sure what you're asking here. The whole post is about the International Tree Ring Data Bank at NOAA NCEI Paleoclimate Data Center.
Tree rings have been used as
Very cool article and outreach
Speaking for Webinar ZOOM event
RE: Speaking for Webinar ZOOM event
Sorry I didn't see this sooner. Comments on older posts are not moderated routinely. If you are still trying to reach Bruce, let me know. For future reference, the most reliable way to contact Climate.gov is to use our webmail addresses: https://www.climate.gov/contact
use of your data in support of study
I have found your tree ring data to be very valuable in double checking my own tree ring measurements from an oak tree palaeoclimate study and much appreciate the efforts you have made in publishing this material in an accessible format.
Tree ring data of 21st century W/O hockey stick mixture
Hi & thanks for an interesting read. Is there an up to date graph of tree ring data per climate such as 2000-2020? Even something like 1980-2020. I can only find graphs that end 22 years ago. I'm in 2022 post COVID times & am interested to see what temperature data in North America looks like via tree rings for the past 20 or 22 years etc. I'd like to be able to compare 21st century data to older data.
Thanks so much.
Mark in Tennessee,
recent tree rings
For specific questions like this, your best bet is to contact that the experts with the International Tree-Ring Data Bank (ITRDB), which is maintained by the NOAA National Centers for Environmental Information. Their contact email is located in the footer of the databank's homepage.
Fair warning, though, I think such a dataset could be hard to find because the whole point of tree-ring data is to create a high-frequency, continuous record of environmental variables like temperature or precipitation over very long periods of time, the longer the better, generally speaking. Just like any other dataset, the shorter the period, the greater the level of uncertainty, so scientists aren't going to have a lot of motivation to create such short records.
But...I am not an expert! Perhaps such records exist as part of efforts to correlate tree ring data to climate variables during the modern observation record or something. Good luck!
Asymmetrical tree rings
I have a recently harvested log from an ash tree planted in West Wales in 1997. The rings are extremely asymmetrical with the centre very close to one side. What does this tell us about the tree's experience?
asymmetry in tree rings
Hi, Len. I will pass this question over to the scientist who wrote this blog. I'm assuming you don't know anything about the site location? My hunch would be this is related to a physical characteristic of the site as opposed to climate. For example, the tree grew up touching a rock formation like a cliff or a big boulder. But maybe something like that could happen with strong, persistent prevailing winds.
Tree age
I have the diameter of a Sycamore tree taken in 2020 and also from a scaled photograph from 1914. Is there a way to estimate its present age?
Re: tree age
As you probably know, the most accurate way to age a tree would be to take a core sample and count the growth rings. But foresters/aborists have come up with ways to broadly estimate a tree's age based on its circumference/diameter and knowledge of the species' typical growth rates in natural forest conditions (where it faces competition). The treehugger website explains how to do this, but unfortunately, the page doesn't include the growth factors for Sycamore (Platanus genus). So you will need to do a web search for its ISA species growth factor. If you can't find it, you could probably contact your county extension agent or the forestry or botany department at your state university.
Tree age
Thanks Rebecca. The use of a growth factor implies that growth is linear with time. Therefore with two measurements at different times the age can be estimated. With my Sycamore, 48" in 2020 and 30" in 1914 the 'birth' calculates to about 1740. Probably good to within +-50 years.
tree ring data
I am working on a paper, just for fun in the SCA, that explains why climate change in medieval Europe forced fashion to change. And this data will help others to look up data in their area of medieval Europe. Thanks for the links
Recent cutting of diseased trees in the Seattle Aboretum
The pines of the Arboretum Park in Seattle are suffering from pine needle fungus which kills the trees and appears to spread among them.
For the past few years park management has been cutting them down as they brown out and die. Now I’m an engineer not a botanist but do find myself observing the stump rings of these cut down trees and what I find is they are all about 85 to 87 years old which matches a period of park development in the 1930’s.
What I see is a clear delineation of growth ring width where they start out quite wide and continue that way for about 60 years then about 25 to 27 years ago there is a marked reduction in growth ring width, it is very easy to see. Every tree that has been cut down shows this, it varies by a couple years where trees higher on the hill show it about 27 years ago while trees toward the bottom of the hill show ir about 25 years ago.
I haven’t found any info that says pine trees slow their growth after 40 years so I see that as an open question? Or am I looking at a change in climate? These are questions for experts to answer, but the change is consistent in its timing and grossly obvious.
RJH Seattle
Caution on interpretation
In northern forest inventory plots, when taking cores from each of the four "sides" of a tree, it is not uncommon for the one or more cores to look very different from the others...like they didn't even come from the same tree! Just a caution in "selecting" a tree or core for a "representative" sample. There are lots of things going on in the forest that may not be very evident.
Cycles
Excellent article, producing increasing references to discuss climate changes with more information and less passion.
I am undergoing a PhD in Energy and Environment, not buying as-is the discussions about global heat and increase in CO2 emissions as sold since the end of last century. Environmental discussions rarely include a 10-20 millennia data about variations of temperature, ice cap areas, volume of CO2, the effects of the Mylankovitch cycles, volcano activity etc., resuming the discussions about the effects of hydrocarbons in the climate. Also, the levels of energy per capita should be included in the discussions, as it grows more than the population increase. The world, in a century of two, will use the hydrocarbons until the last coal piece has been burnt, and Nature will do its part independent of mankind.
Add new comment