Data Snapshots Image Gallery
Antarctic Sea Ice Extent - Maximum
- Dataset Details
- Monthly winter images from 1979 to present
- Download Directories
- Click on any of the links below to view a directory listing of images and assets related to this dataset.
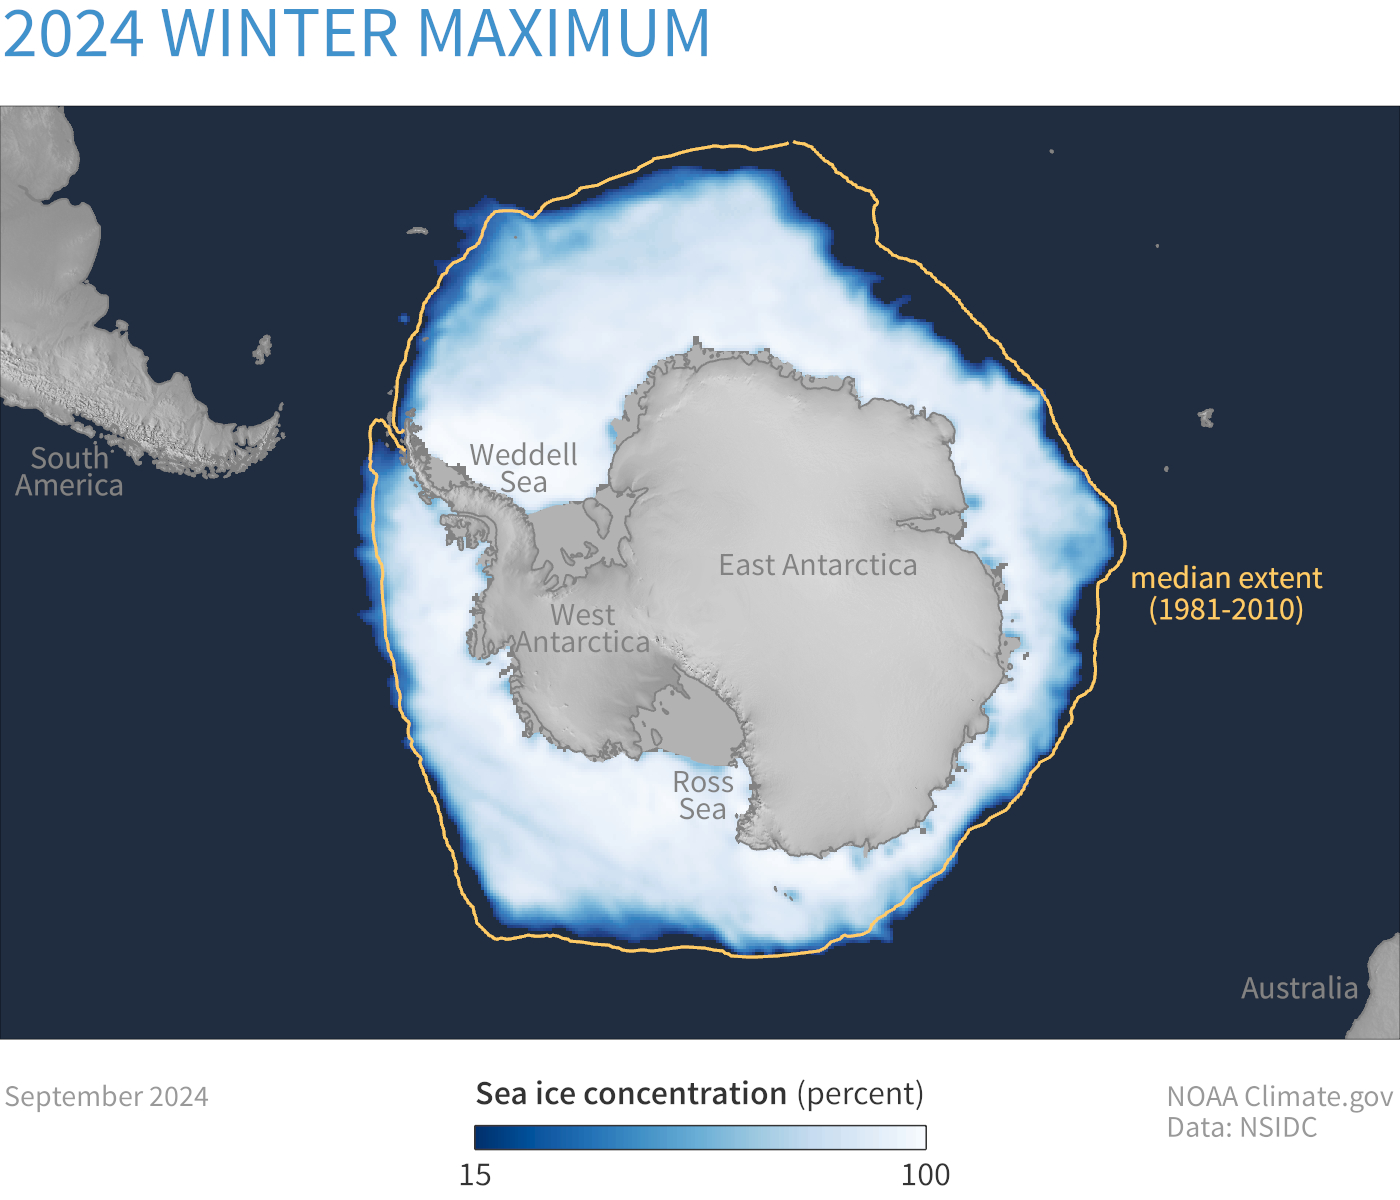
This collection includes monthly maps for sea ice concentration during the month of the Antarctic winter maximum extent—typically September, rarely October—dating back to the start of the satellite record in 1979. Over that time period, Antarctic sea ice has exhibited an essentially flat trend with substantial year-to-year variability. Beginning in 2016, Antarctic sea ice experienced below-average extents, but as of 2025, determining whether these extents indicate the beginning of an overall downward trend will require at least several more years of observations.
These measurements come from polar-orbiting satellites, which have observed sea ice on a daily basis for several decades. Satellite sensors used for sea ice observation record more than just visible light; they sense microwaves and other frequencies of electromagnetic radiation. That allows them to “see” through clouds and in the dark to make sea ice observations throughout a range of weather conditions and polar darkness.
Each map shows average monthly sea ice concentration. Sea ice concentration describes how much of a given area is covered with sea ice. Sea ice concentration is usually expressed as a percentage, for instance, 10 percent or 54 percent or 86 percent. Sea ice concentration appears in shades of blue and white, with lighter shades indicating higher ice concentrations. Sea ice extent is derived from measurements of sea ice concentration. Extent is the area of the ocean with at least 15 percent sea ice concentration. Any area meeting or exceeding the 15-percent concentration threshold is considered ice-filled. The yellow line shows the 1981–2010 median extent for that month. Median means halfway between the largest and smallest values. Land areas are gray. The ice-free ocean is navy blue.
Sea ice provides crucial habitat for iconic Antarctic species such as penguins, and rich ecosystems exist under the ice. Sea ice provides a barrier between ocean waves and the fronts of ice shelves. (Ice shelves are thick slabs of ice that extend from land over the ocean surface and glacier-fed ice shelves occur in many locations along the Antarctic coastline.) Therefore, the loss of sea ice may contribute to ice shelf destabilization and potentially glacier acceleration into the ocean. As it does in the Arctic Ocean, sea ice affects ship traffic around the coastline of Antarctica. Studying sea ice over time enables scientists to monitor how the Antarctic is changing.
Data Snapshots are derivatives of existing data products. To meet the needs of a broad audience, we present the source data in a simplified visual style. Climate.gov made these images using data from the Sea Ice Index provided by the National Snow and Ice Data Center. The Sea Ice Index includes daily and monthly observations of sea ice concentration and extent. Climate.gov applied an intuitive color palette to indicate concentration level, and added the median extent line for each month shown in these snapshots.
Concentration data exists as geotiffs. Median extent lines exist as shapefiles.
References
- NSIDC Sea Ice Today
- NSIDC Sea Ice Today - About the data
- Fetterer, F., Knowles, K., Meier, W. N., Savoie, M. & Windnagel, A. K. (2017). Sea Ice Index. (G02135, Version 3). [Data Set]. Boulder, Colorado USA. National Snow and Ice Data Center. https://doi.org/10.7265/N5K072F8. Date Accessed 05-20-2025.
- Data Provider
- National Snow and Ice Data Center
- Source Data Product
- Sea Ice Index, Version 3
- Access to Source Data
- NOAA@NSIDC HTTPS File System
- Reviewer
- Walt Meier, Ted Scambos
