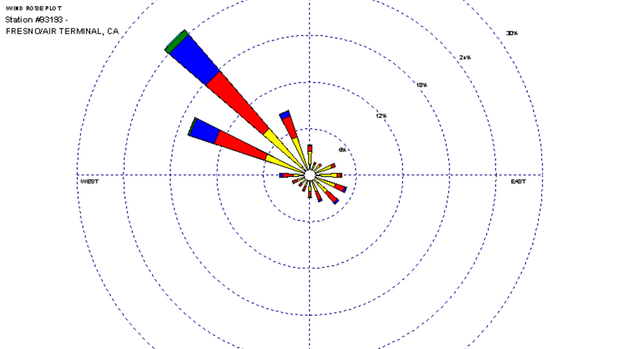
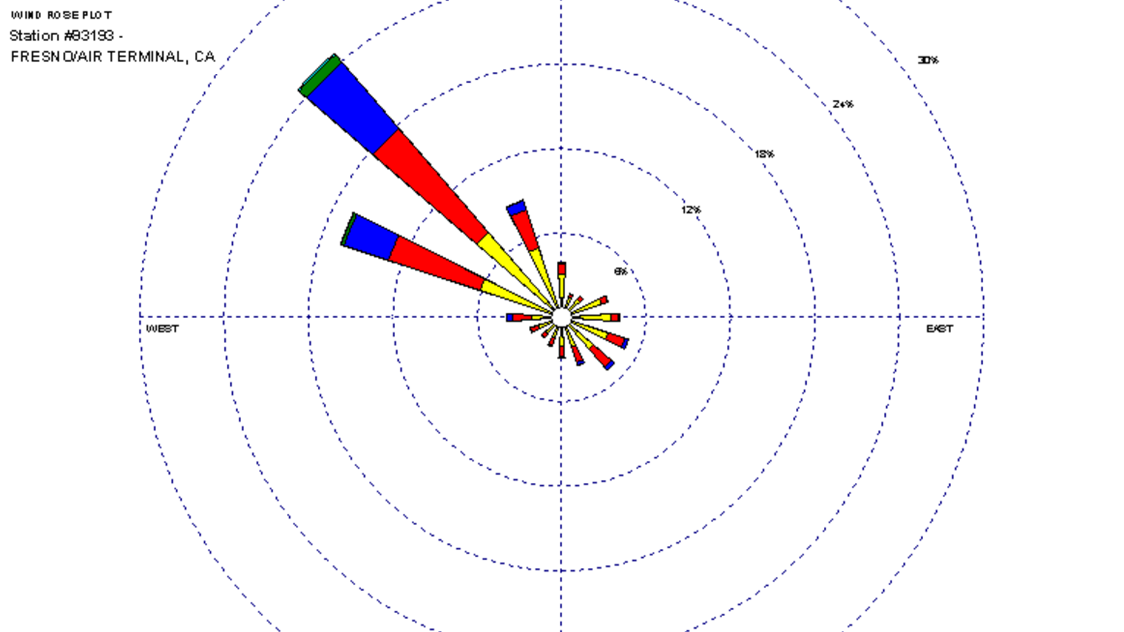
Wind roses are graphical charts that characterize the speed and direction of winds at a location. Presented in a circular format, the length of each "spoke" around the circle indicates the amount of time that the wind blows from a particular direction. Colors along the spokes indicate categories of wind speed. This site offers wind roses for each month of the year and instructions for interpreting them. Graphics are available for 237 cities across the United States. Note that this is a historical data product: it shows average wind speed and direction measured from 1961-1990.
Where do these data come from?
The US Department of Agriculture's Natural Resources Conservation Service prepared these wind roses. The plots are based on hourly data from the Solar and Meteorological Surface Observation Network.
Background: Winds measured at airports are normally 2 or 3 minute averages of 3 or 5 second samples at the top of every hour—not gusts. Automated Surface Observation System (ASOS) equipment used at most locations since 1996 or so automatically records wind measurements from cup anemometer values. Older observations (generally prior to 1996) represent data recorded by personnel working at weather stations who manually observed wind speed and direction at the top of every hour, and made an estimation of hourly winds over some time period, typically 2 to 5 minutes in length.
What can I do with these data?
- Explore how winds change at a single location over the twelve months or four seasons of year.
- Compare winds at different locations during the same month.
- Find and download more recent wind data (from 1991-2020, for example), and use the free tool, WR-PLOT to generate new wind roses to compare to the older ones.
-
How do I use the site?
- Go to this site: Wind Rose Plots.
- Click a state in the list.
- Click a city of interest.
- View the .gif file for one or more months.
-
Data Format(s)Other
Access Type Link & Description Download Prepared wind rose images for each month of the year (based on observations from 1961-1990) are available by state and city in GIF and EMF format. -
Documentation Type Link & Description General Joint NCDC and NREL product available for purchase on CD-ROM that contains hourly solar and meteorological data, including wind direction (true north) and speed, for 237 NWS stations in the United States, plus offices in Guam and Puerto Rico, for the period 1961-1990. -
Data TypeLand-based stationEssential Climate VariablesWind speed and direction
 Click to see more detail
