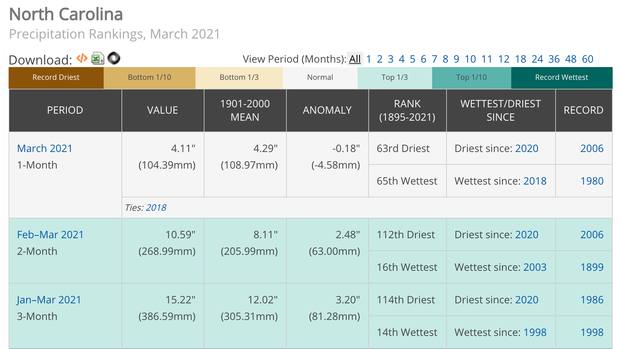
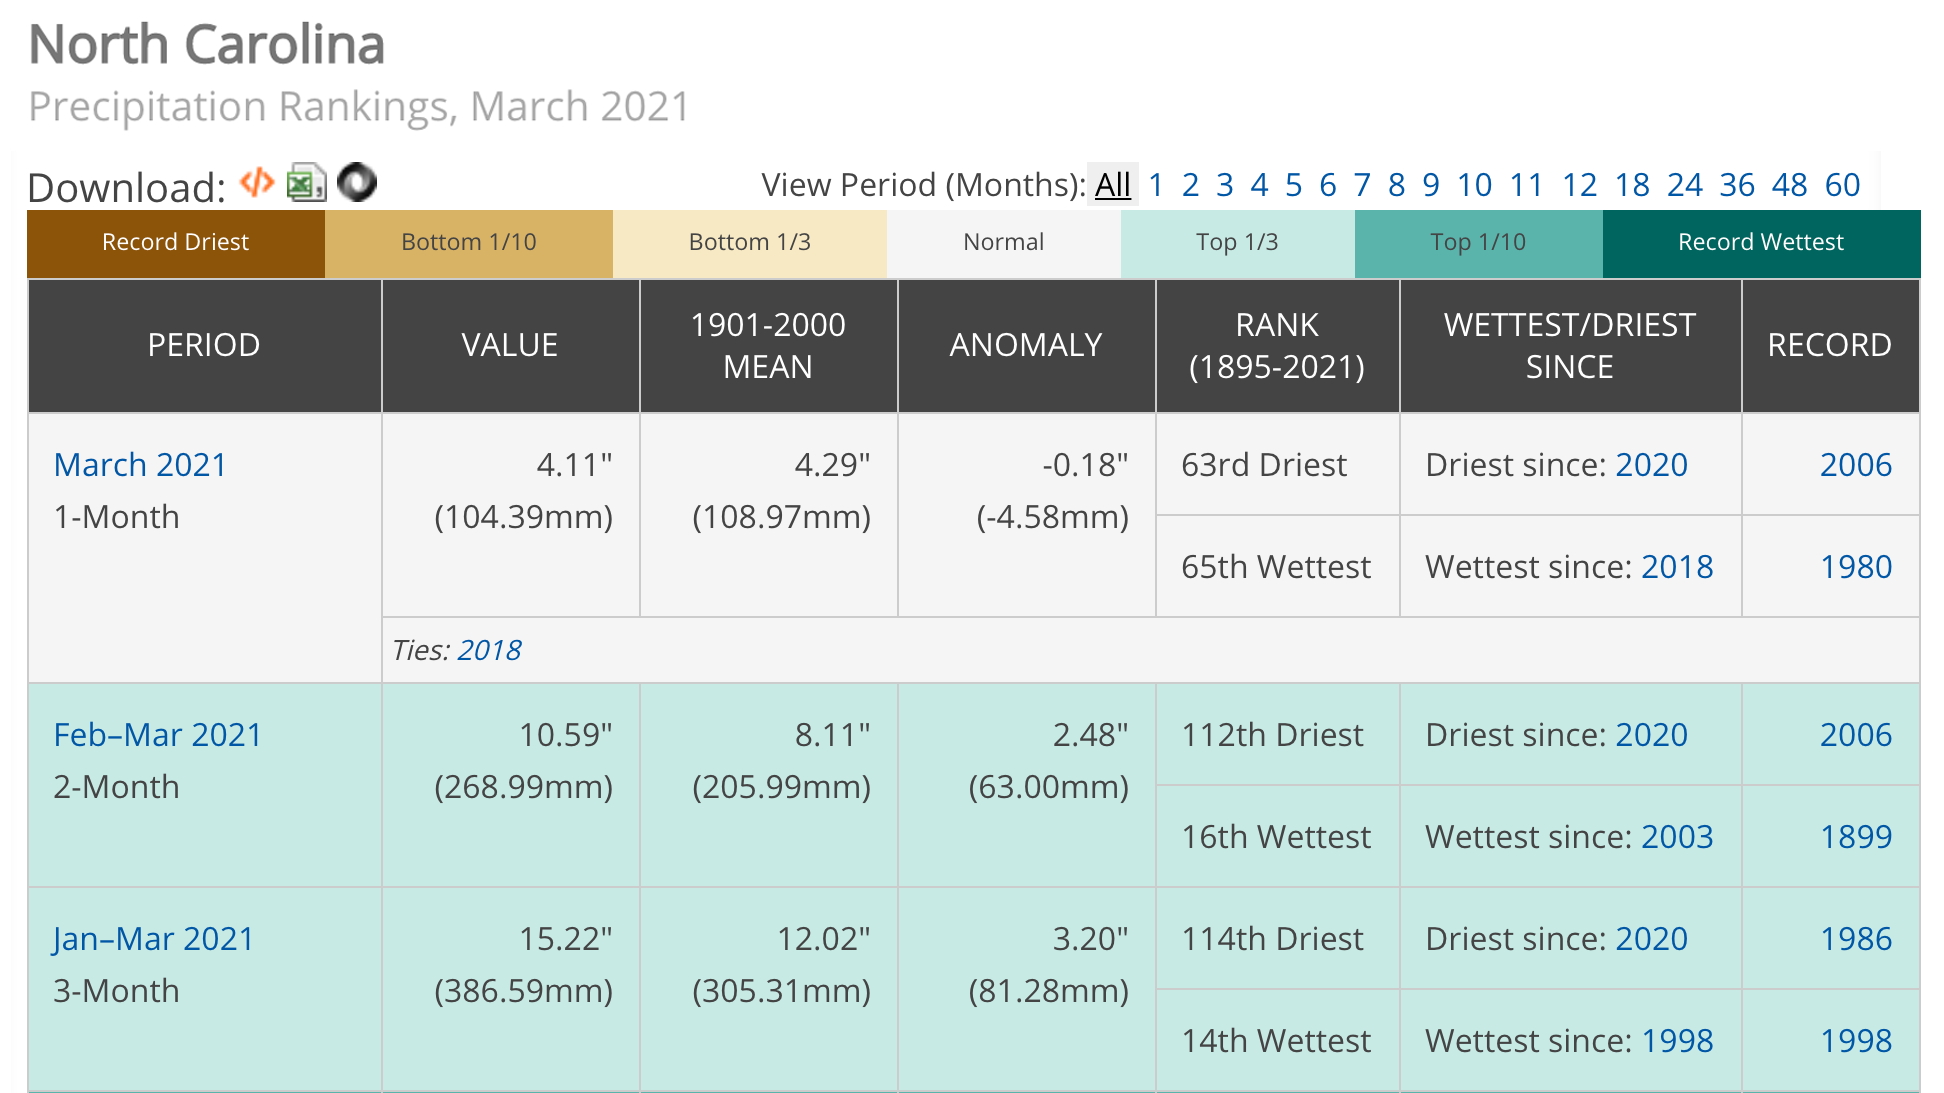
When you hear or see news that a region had its hottest or wettest month since records began, you can check the climatological record books yourself. Access this tool to see how conditions for various locations and time periods rank among the historical record.
Where do these data come from?
Weather stations across the country gather daily observational data such as the high and low temperature of the day and the amount of precipitation that fell. Results from across the country are compiled at the National Center for Environmental Information in Asheville, North Carolina. After quality control of the data (for instance, removing values that indicate an instrument is not working), monthly values are averaged across geographic areas (division, state, region, etc.). The averaged values are sorted from lowest to highest value for the entire period of record. The sorted list shows how each period compares to the full range of previous values.
-
What can I do with these data?
Find out how monthly observations of temperature or precipitation for a selected city or area compare to other months in the historical record since 1895.
How do I use the site?
Go to https://www.ncdc.noaa.gov/cag/national/rankings.
- Along the top, select your geography of interest - Global, National, Regional, Statewide, Divisional, County, or City
- Parameter - Select Temperature, Precipitation, or another variable
- Select the Year and Month of interest
- Select the specific state and/or region of interest
- Click the Update button
-
Data Format(s)TXT (ASCII), CSV, JSON
Access Type Link & Description Download Look up monthly U.S., Statewide, Divisional, and Regional Temperature, Precipitation, Degree Days, and Palmer (Drought) rankings for 1-12, 18, 24, 36, 48, 60-month, and Year-to-Date time periods. -
Documentation Type Link & Description General More information on climatological rankings. -
Data TypeLand-based stationEssential Climate VariablesAir temperature,Science OrganizationNOAA's National Centers for Environmental Information
 Click to see more detail
