When measurements of atmospheric carbon dioxide began at Mauna Loa Observatory in 1958, monthly averages (light purple line) were below 320 parts per million (ppm). By the start of 2025, the 12-month running average had reached 425 ppm.
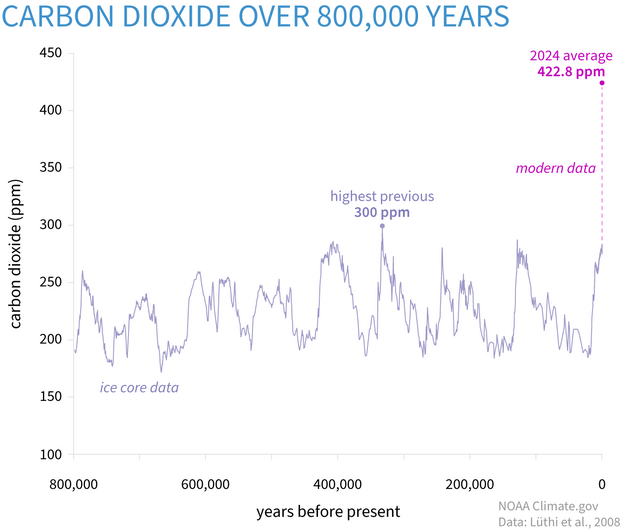
The amount of carbon dioxide in the atmosphere during ice ages and warm periods over the past 800,000 years, based on Antarctic ice core data (Lüthi, D. et al, 2008). On this time scale, the increase to 2024’s 422.8 parts per million (bright magenta dot) looks practically instantaneous.