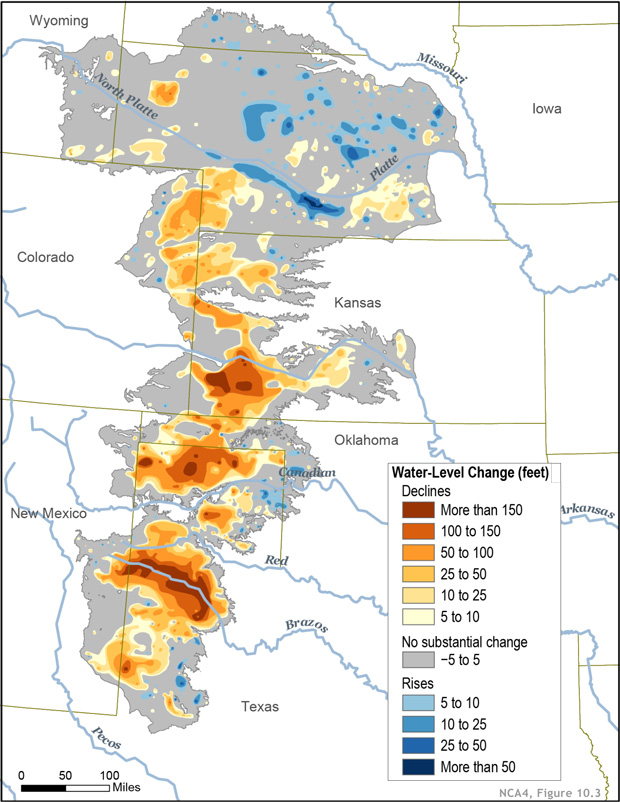
Image caption
This map shows changes in Ogallala water levels from before the aquifer was tapped to 2015. Declining levels are red or orange, and rising levels are blue.
This map shows changes in Ogallala water levels from before the aquifer was tapped to 2015. Declining levels are red or orange, and rising levels are blue.