
Image caption
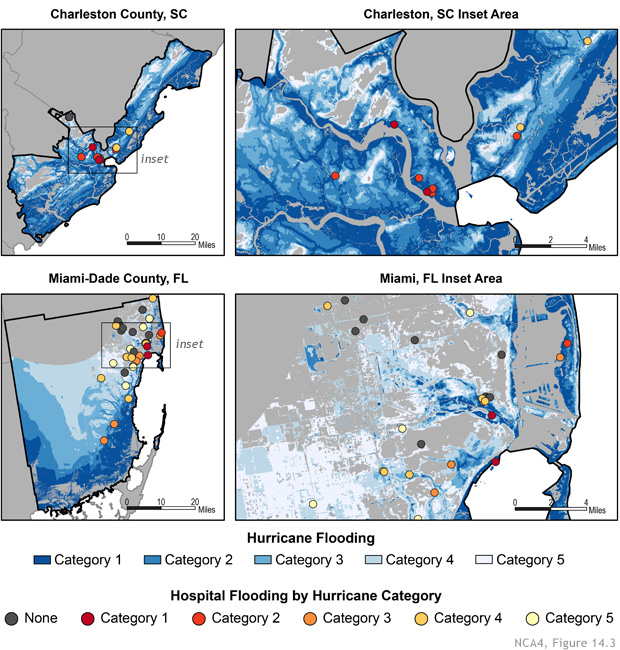
The maps show projected hurricane flooding in blue, and affected hospitals yellow, orange, or red dots. The darker the color, the lower the hurricane category needed to flood the hospital and its surroundings.
The maps show projected hurricane flooding in blue, and affected hospitals yellow, orange, or red dots. The darker the color, the lower the hurricane category needed to flood the hospital and its surroundings.