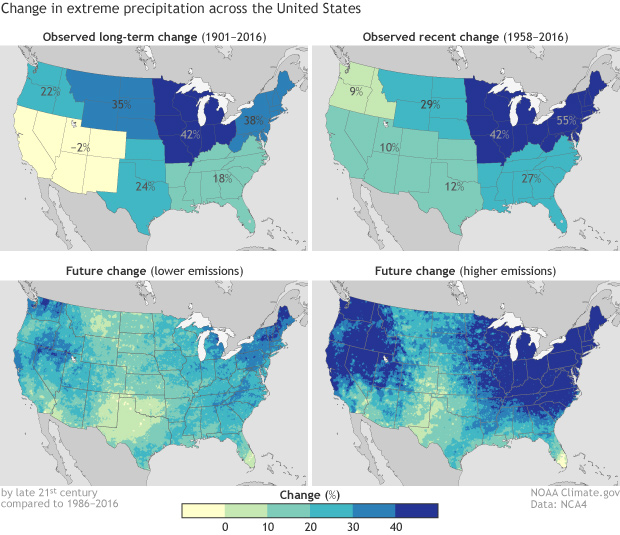
Image caption
These maps show observed (top row) and predicted (bottom row) changes in extreme precipitation in the United States. Bigger increases appear in darker colors.
These maps show observed (top row) and predicted (bottom row) changes in extreme precipitation in the United States. Bigger increases appear in darker colors.