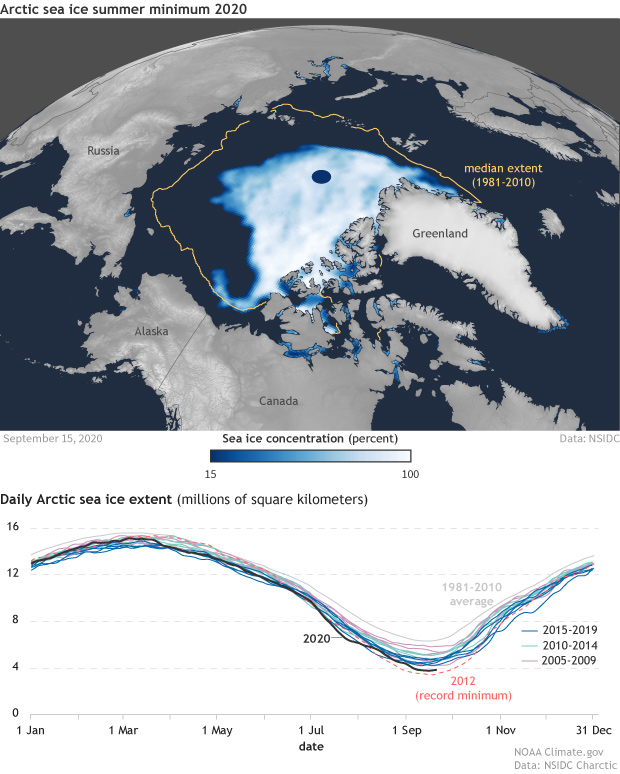
Image caption
(top) Sea ice concentration (light blue to white) on September 15, 2020, the day of the summer minimum extent. The gold line is the median extent for 1981-2010: half of years had smaller extents, half had larger. (bottom) A graph of daily ice extent since 2005. Years 2005-2009 are light purple, the record-low year 2012 is salmon, other years for 2010-2014 are light green, and years 2015-2019 are blue. The 2020 daily extent line is in black. NOAA Climate.gov image, based on data from the National Snow and Ice Data Center.