
Image caption
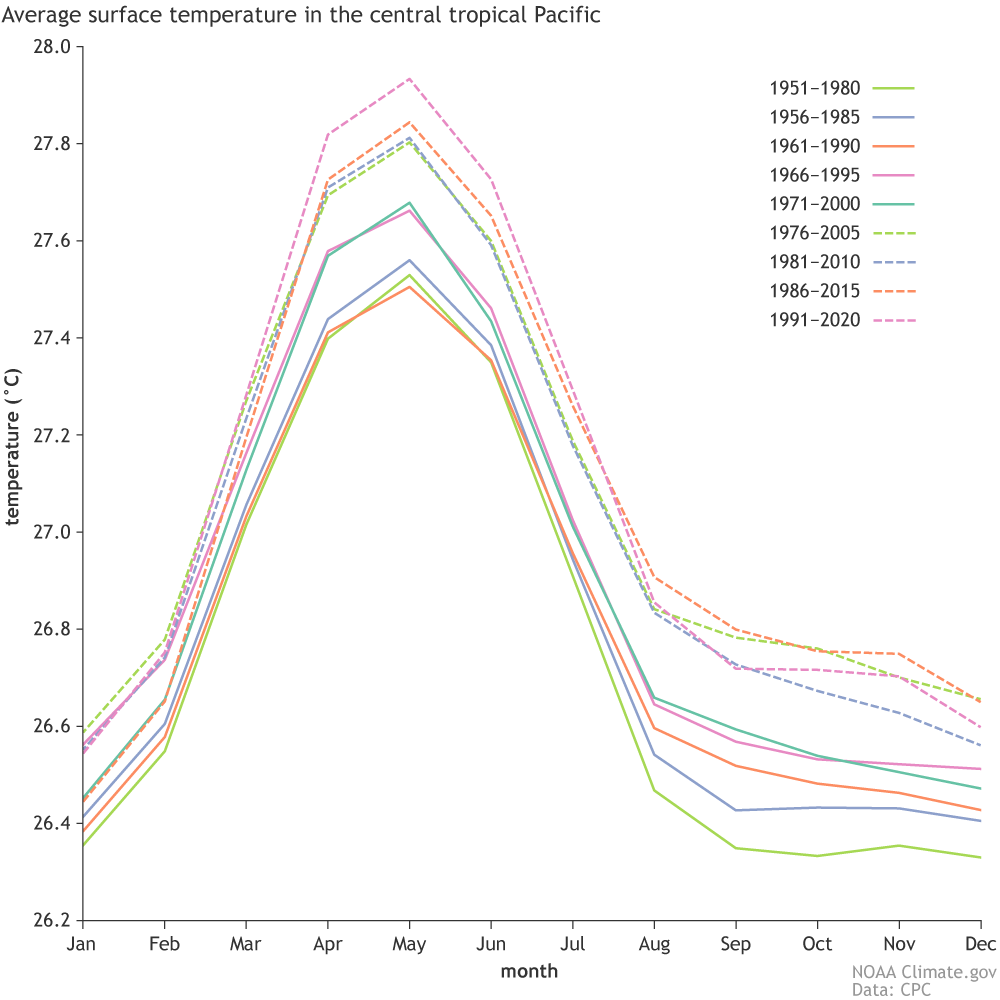
Thirty-year average periods that NOAA is using to calculate the strength of historic El Niño and La Niña events. Climate.gov figure from ERSSTv5 data, based on CPC original.
Thirty-year average periods that NOAA is using to calculate the strength of historic El Niño and La Niña events. Climate.gov figure from ERSSTv5 data, based on CPC original.