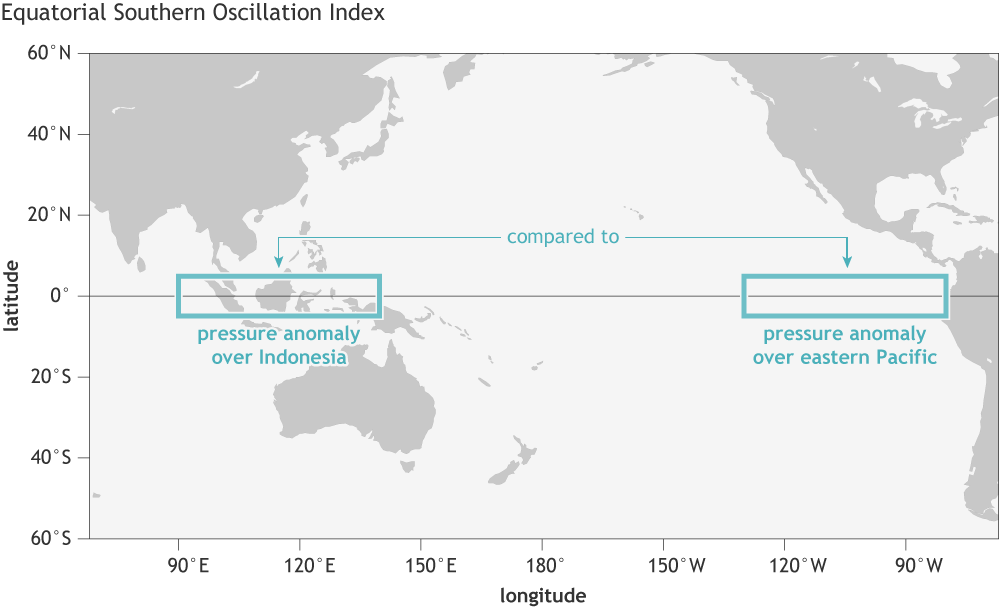
Image caption
The Equatorial Southern Oscillation Index compares pressure anomalies across a broad region of the eastern tropical Pacific (5 degrees North and South latitude, 80–130 degrees West longitude) to pressure anomalies on the other side of the basin (5 degrees North and South latitude, 90–140 degrees East longitude). NOAA Climate.gov image by Fiona Martin.