
Image caption
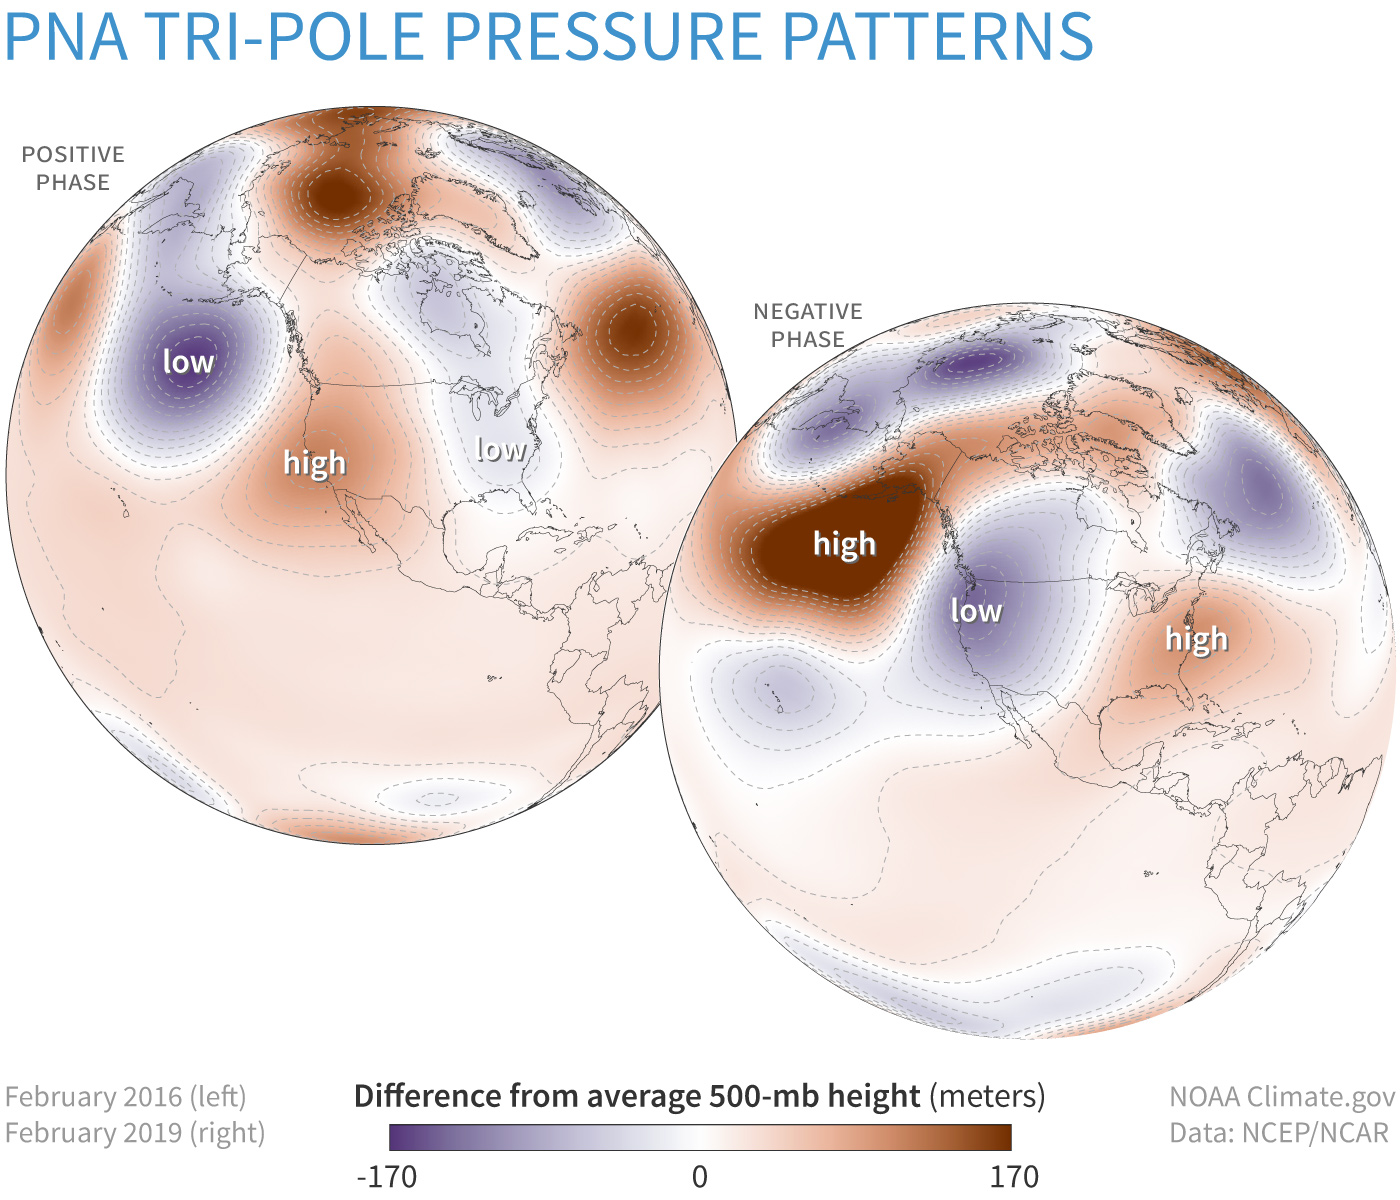
The Pacific-North American atmospheric pattern has two phases. The top map shows pressure patterns in February 2016 compared to the 1981-2020 average (positive phase), and the bottom shows February 2019 (negative phase). The location of highs and lows and the flow of the jet stream around them often produce a sharp warm-cold split in temperatures in the western and eastern halves of the United States. The negative phase is also linked to favorable conditions for tornado outbreaks. NOAA Climate.gov, based on data from the Physical Science Lab.