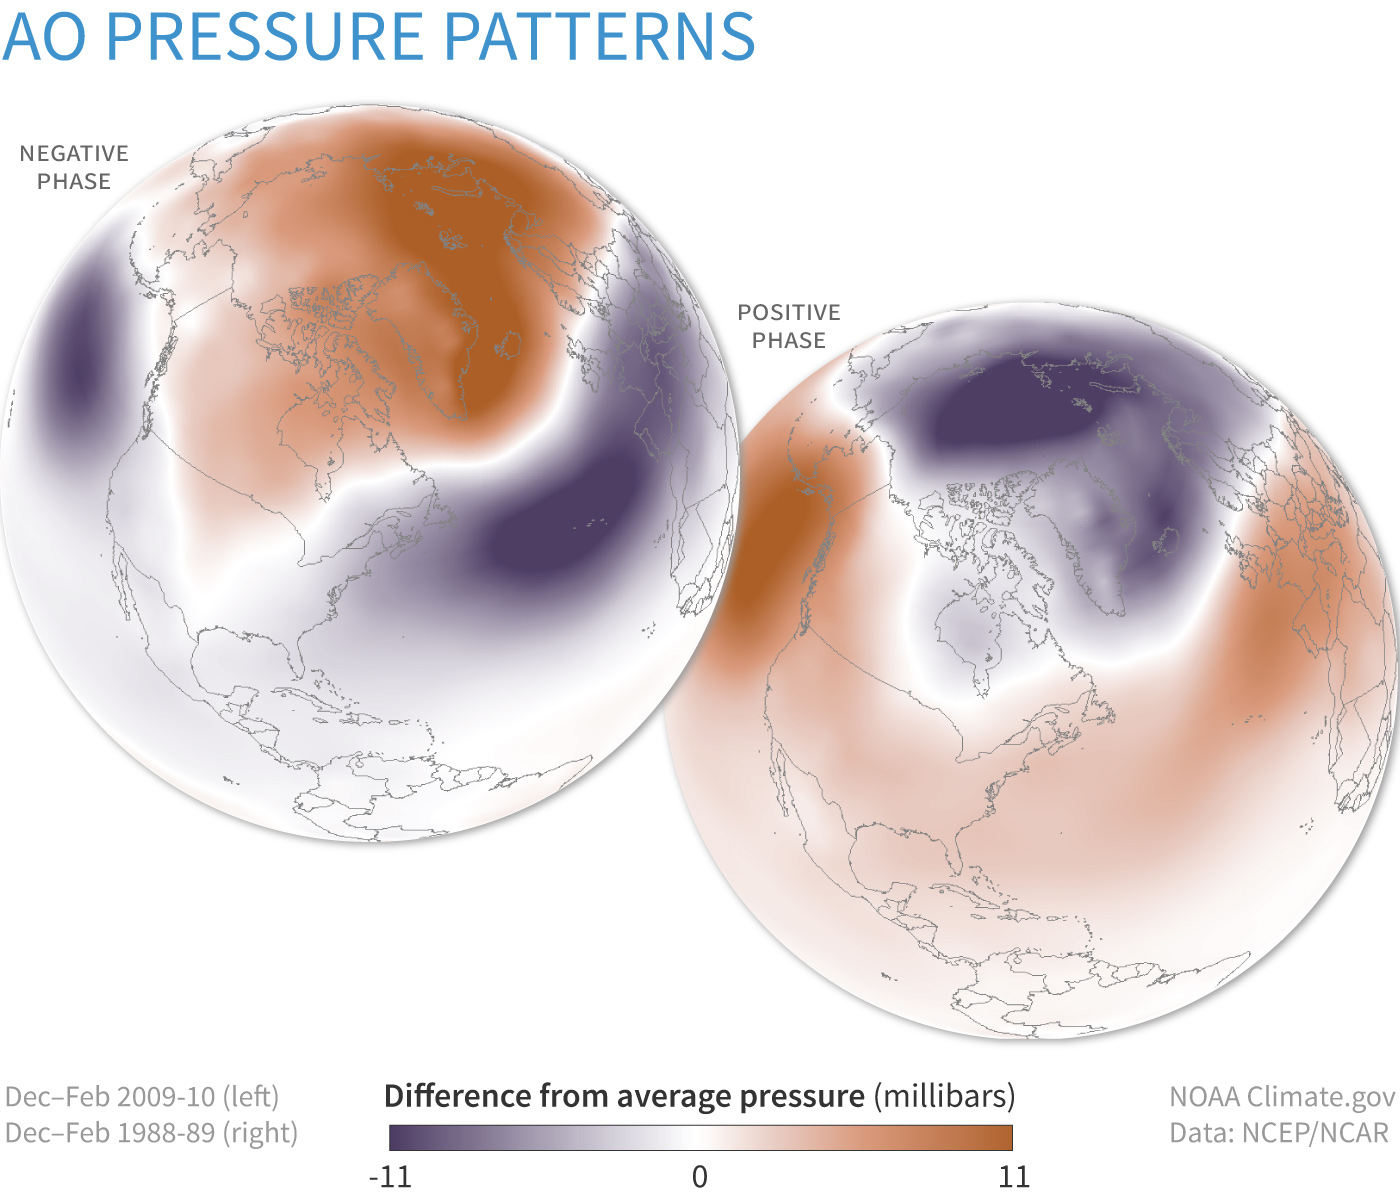
Image caption
Winter surface pressure across the Northern Hemisphere compared to the 1981-2010 average when the Arctic Oscillation (AO) was strongly negative (top, 2009-10) and when it was strongly positive (bottom, 1988-89). The negative AO favors a warm Arctic and cool conditions across the U.S. and Europe. The positive phase favors a cool Arctic and relatively warm conditions in the mid-latitudes. NOAA Climate.gov image, based on data from the Physical Sciences Lab.