
Image caption
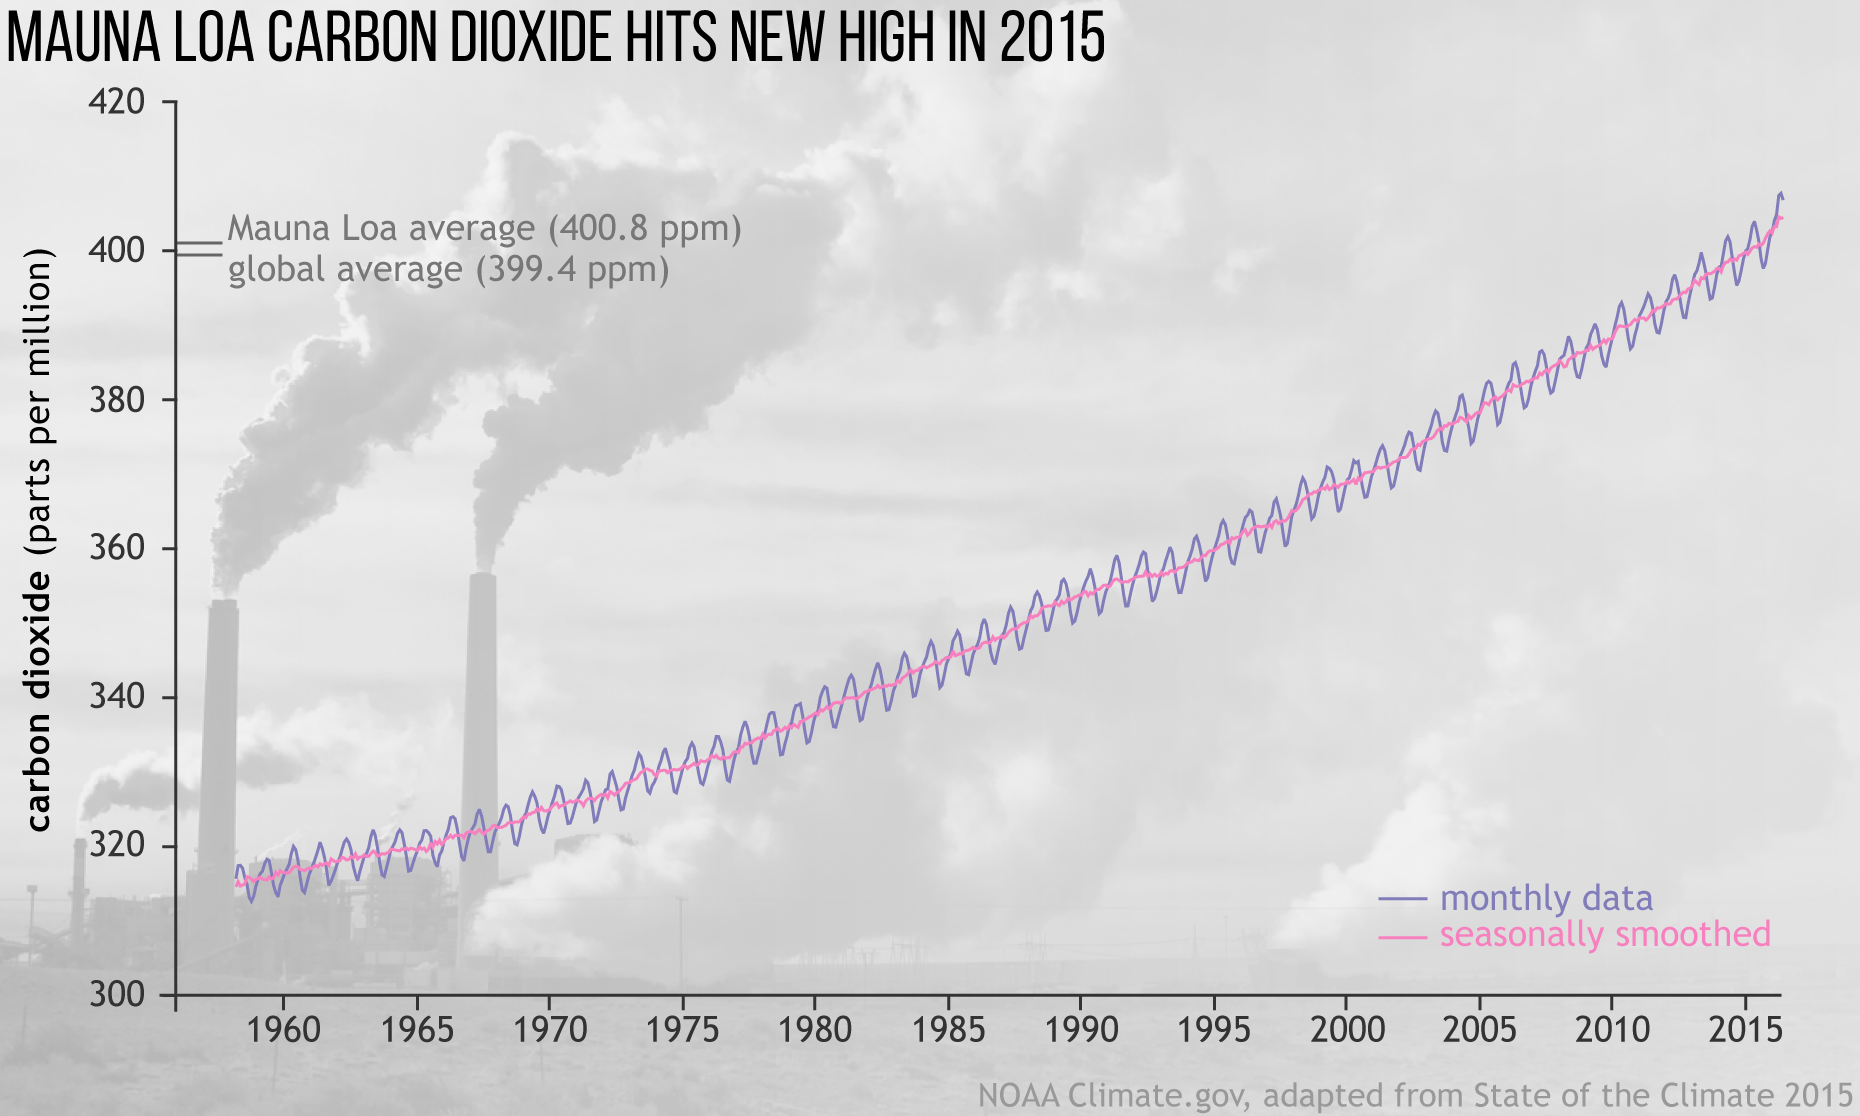
Monthly average carbon dioxide amounts (blue line) measured at Mauna Loa observatory. The bright pink line shows carbon dioxide concentrations with the seasonal cycle smoothed out. Full story.
Monthly average carbon dioxide amounts (blue line) measured at Mauna Loa observatory. The bright pink line shows carbon dioxide concentrations with the seasonal cycle smoothed out. Full story.