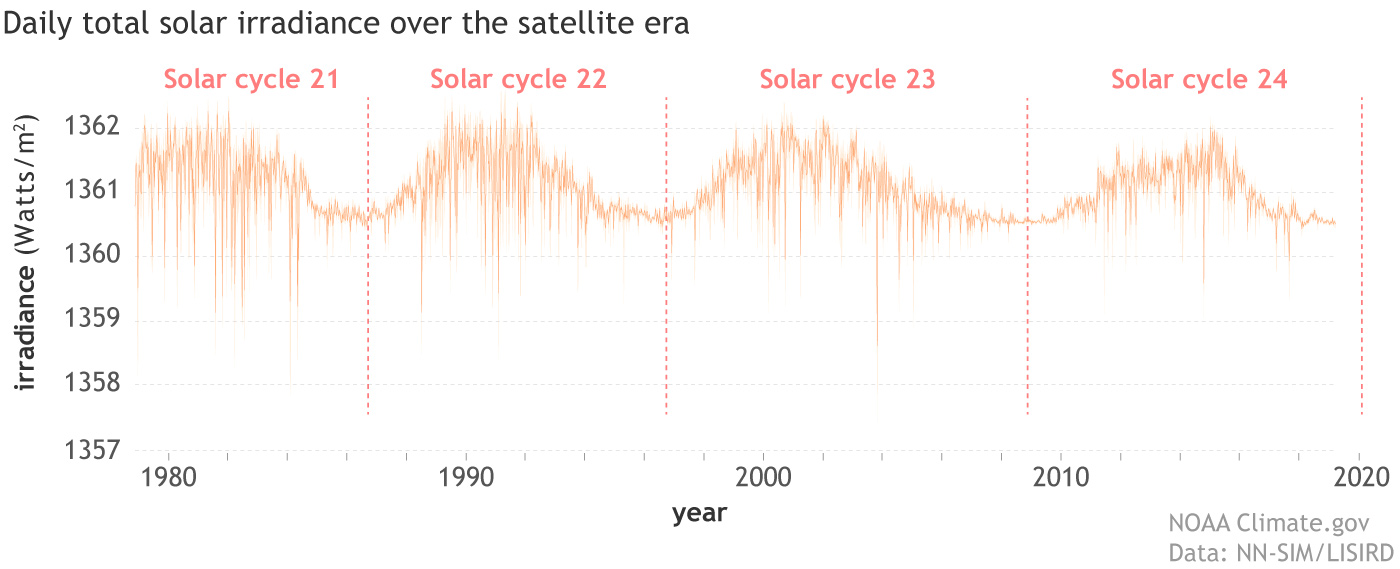
Image caption
Daily observations of total solar irradiance (orange line) since the start of the satellite era in 1978. Day-to-day, TSI may vary by as much as 0.3 percent, but average differences between maximum and minimum are on the order 0.1 percent, or around 1 Watt per square meter. NOAA Climate.gov image, based on data from LASP Interactive Solar Irradiance Data Center.