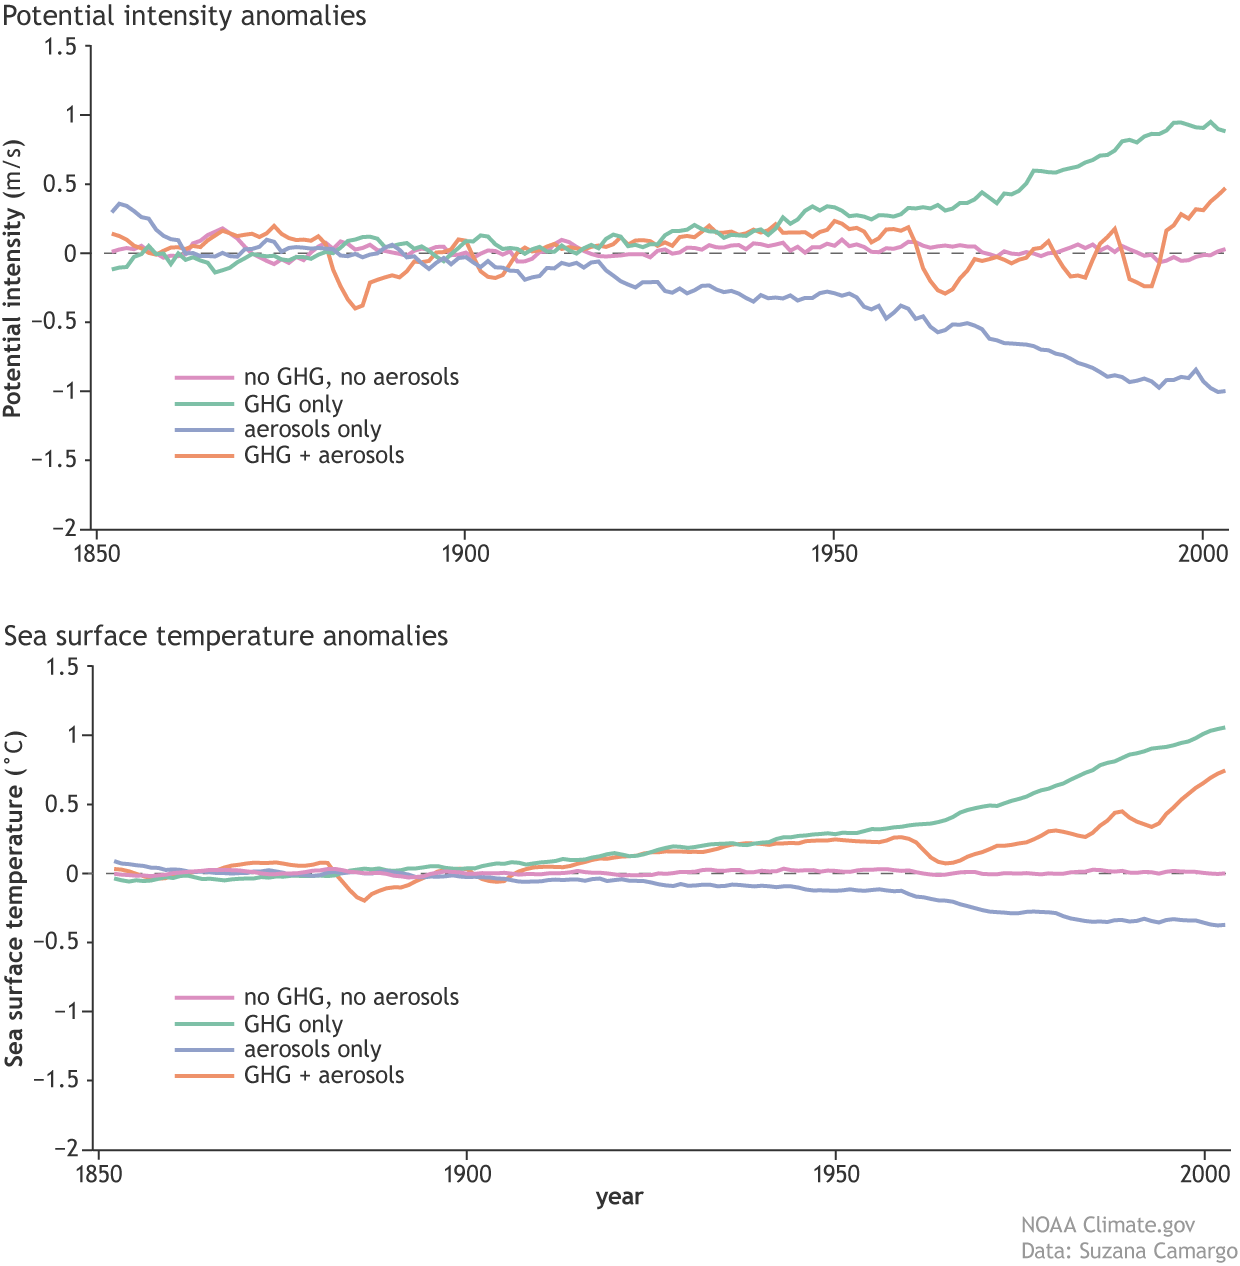
File name: Fig1R_Section_a_c_Lg.png Original Resolution (pixels): 1240 × 1266 File Size: 104 KB (MIME Type: image/png) Date Published: October 10, 2021 Alternate Text: Potential intensity and SST graphs View image full size Download file