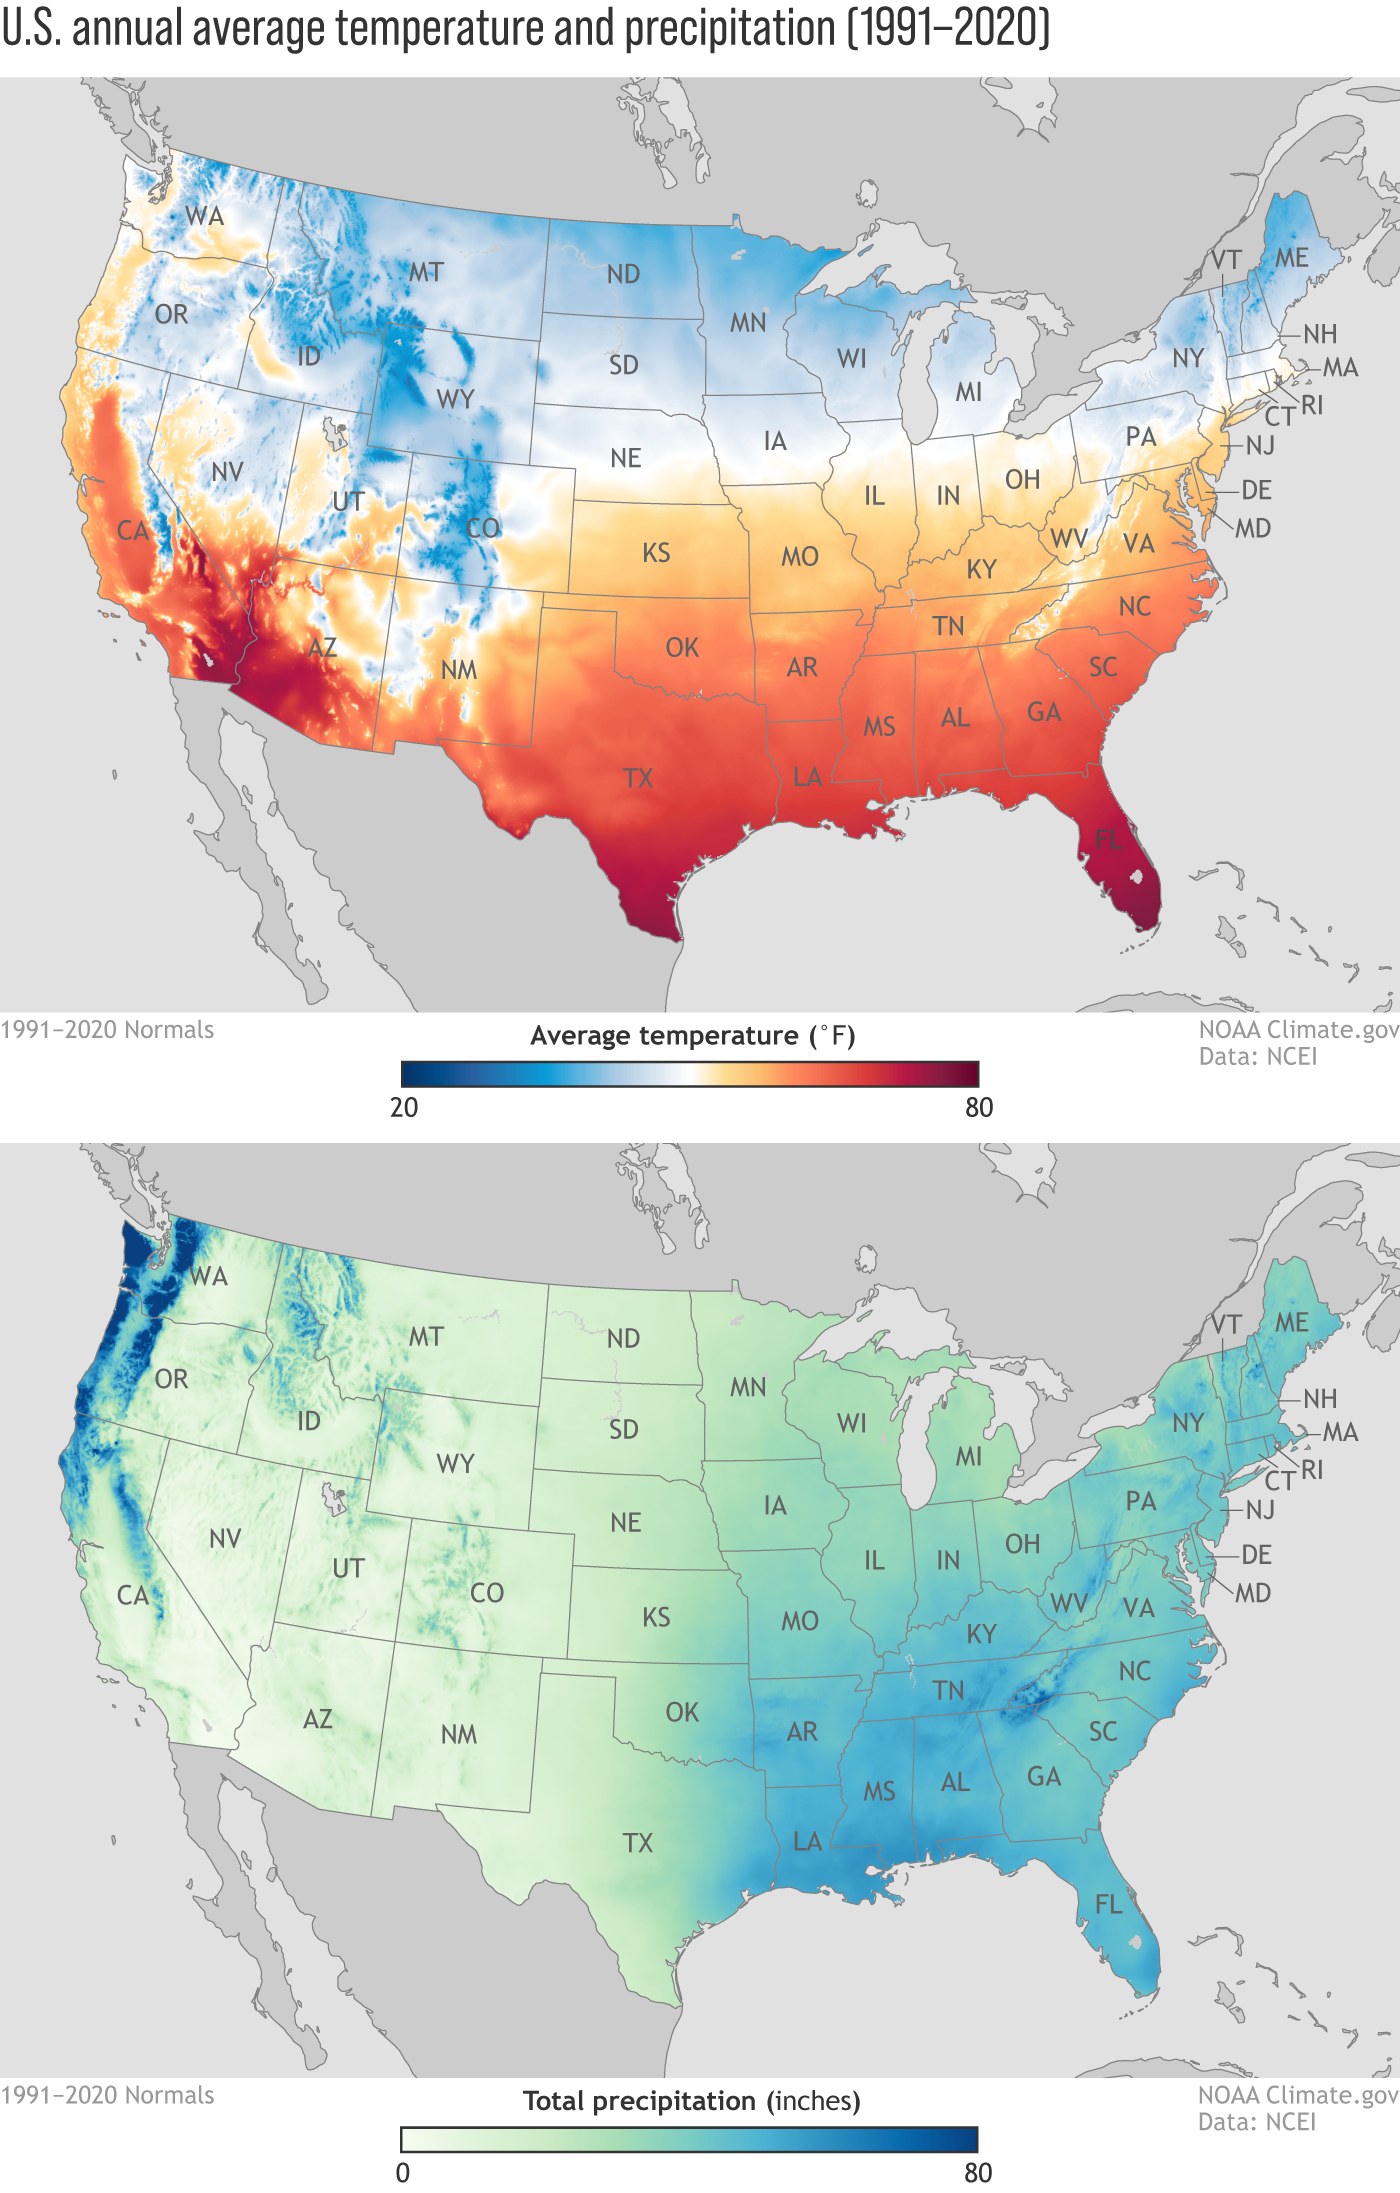
Image caption
U.S. annual average temperature (top) and precipitation (bottom) based on the 1991-2020 U.S. Climate Normals. Maps by NOAA Climate.gov, based on data from NOAA National Centers for Environmental Information.
U.S. annual average temperature (top) and precipitation (bottom) based on the 1991-2020 U.S. Climate Normals. Maps by NOAA Climate.gov, based on data from NOAA National Centers for Environmental Information.