
Image caption
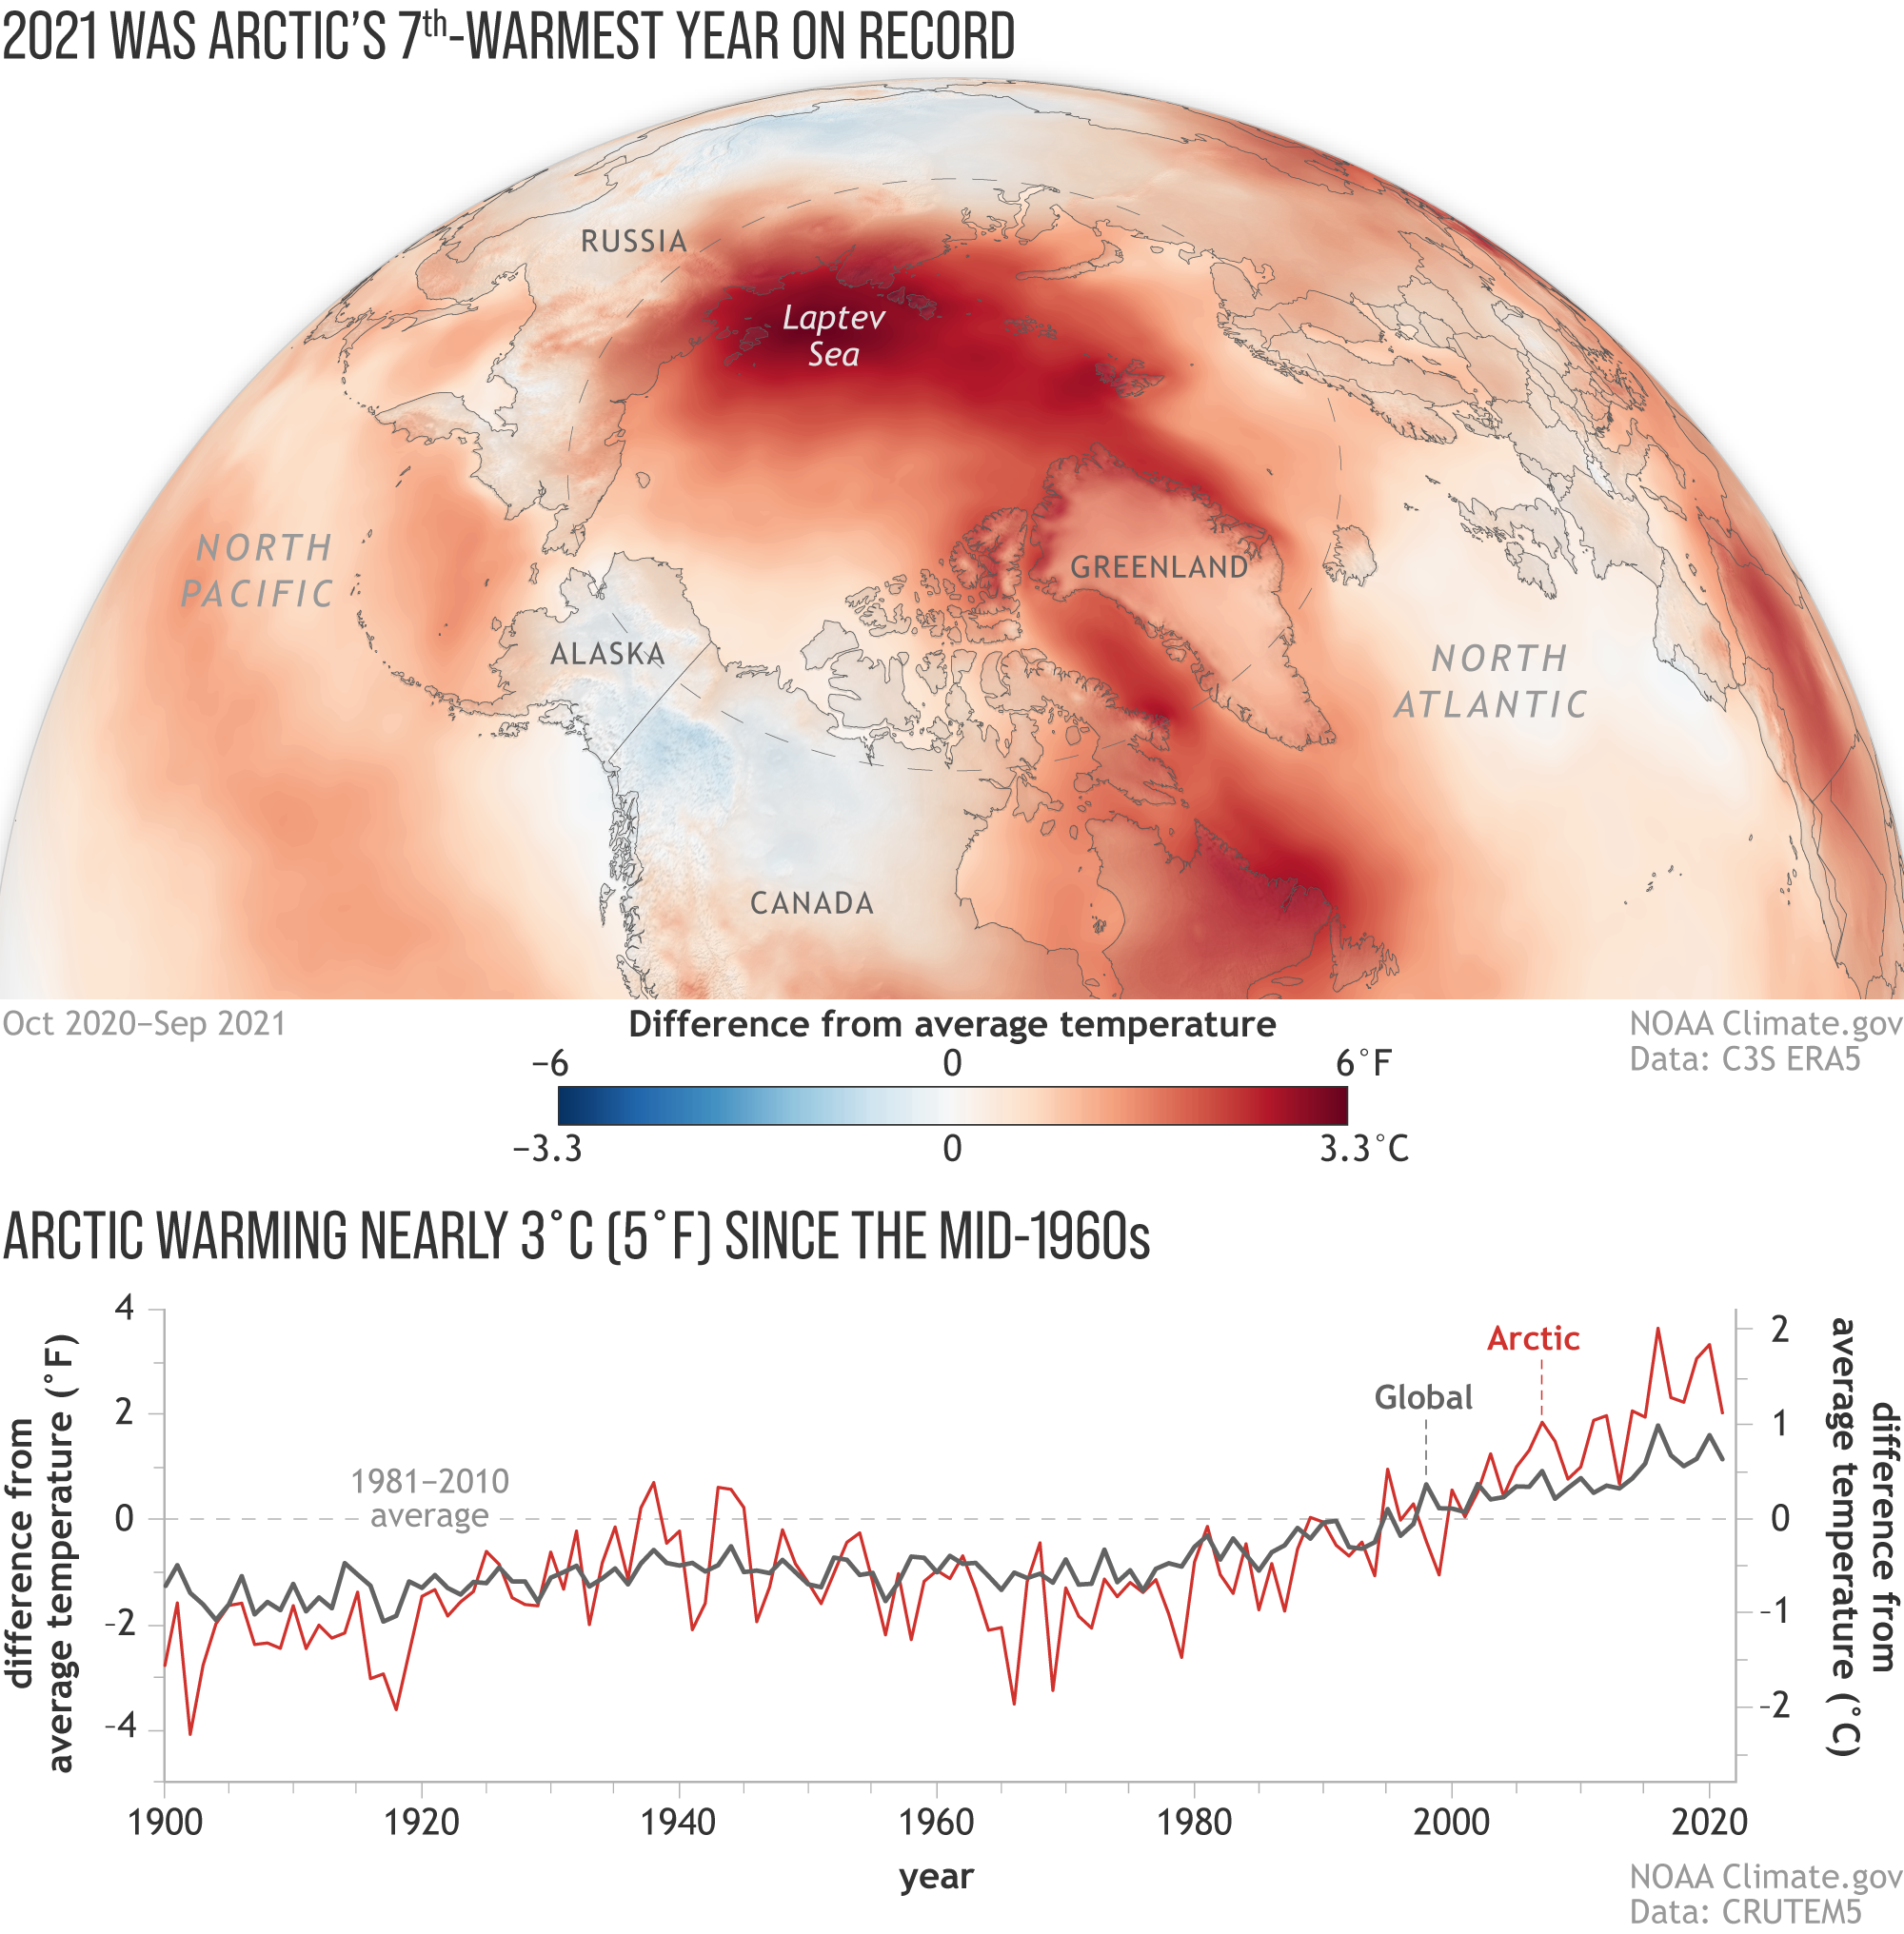
(map) Annual temperature (October 1, 2020–September 30, 2021) across the Arctic compared to the 1981-2020 average. Deep reds across the Eurasian Arctic over the Laptev Sea show the imprint of a record-warm fall. NOAA Climate.gov map, based on ERA5 Reanalysis data from the Copernicus Climate Change website. (graph) Since 2000, Arctic warming (red line) has been more than twice the global average (black line). NOAA Climate.gov image, adapted from Figure 1, in the Surface Air Temperature essay in the 2021 Arctic Report Card, based on CRUTEM5 data.