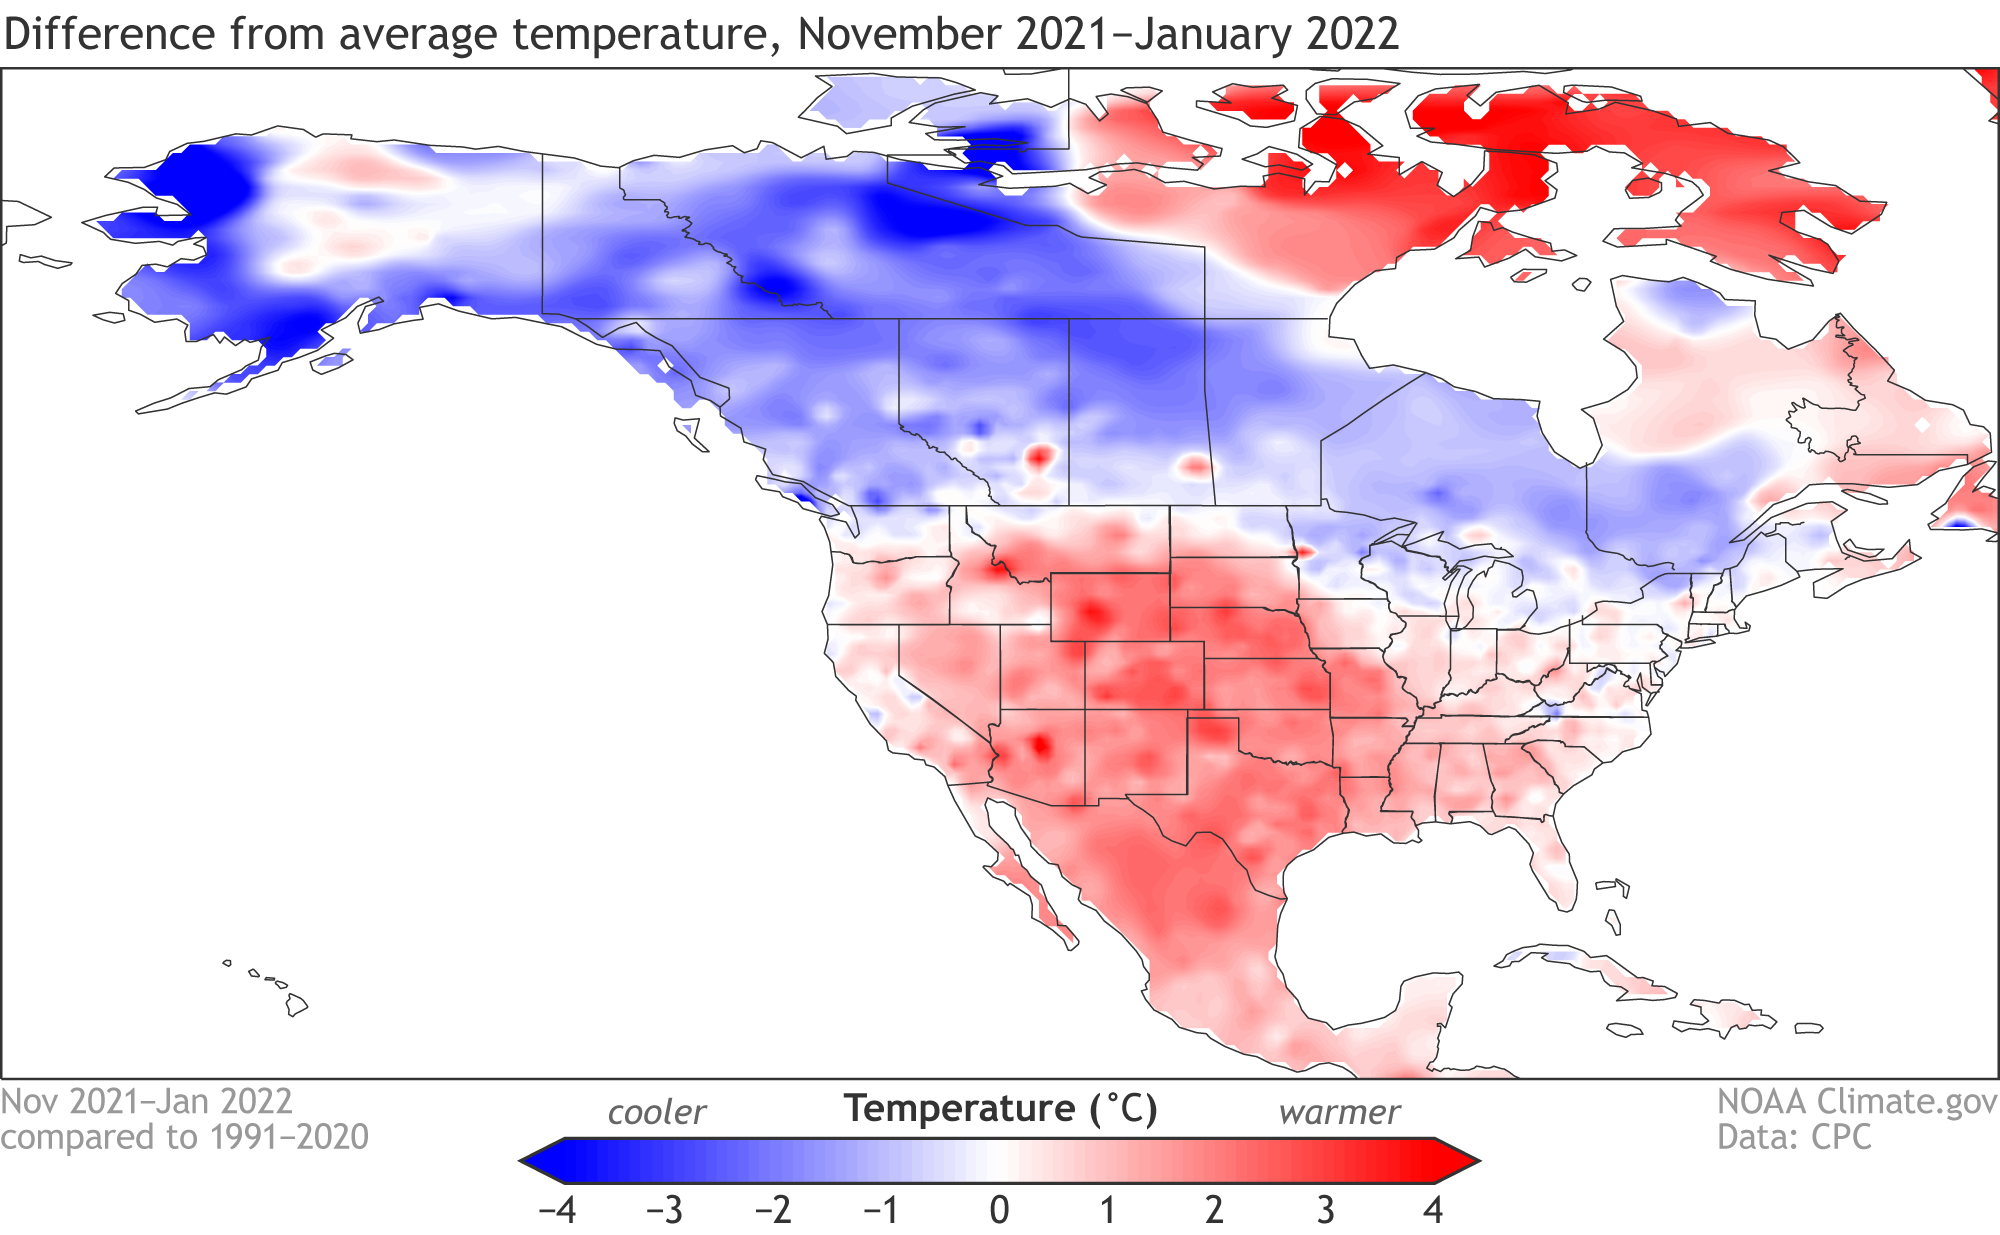
Image caption
Surface temperature difference from the 1991–2020 long-term average during November 2021–January 2022. Map by climate.gov from CPC Global Daily Precipitation data.
Surface temperature difference from the 1991–2020 long-term average during November 2021–January 2022. Map by climate.gov from CPC Global Daily Precipitation data.