
Image caption
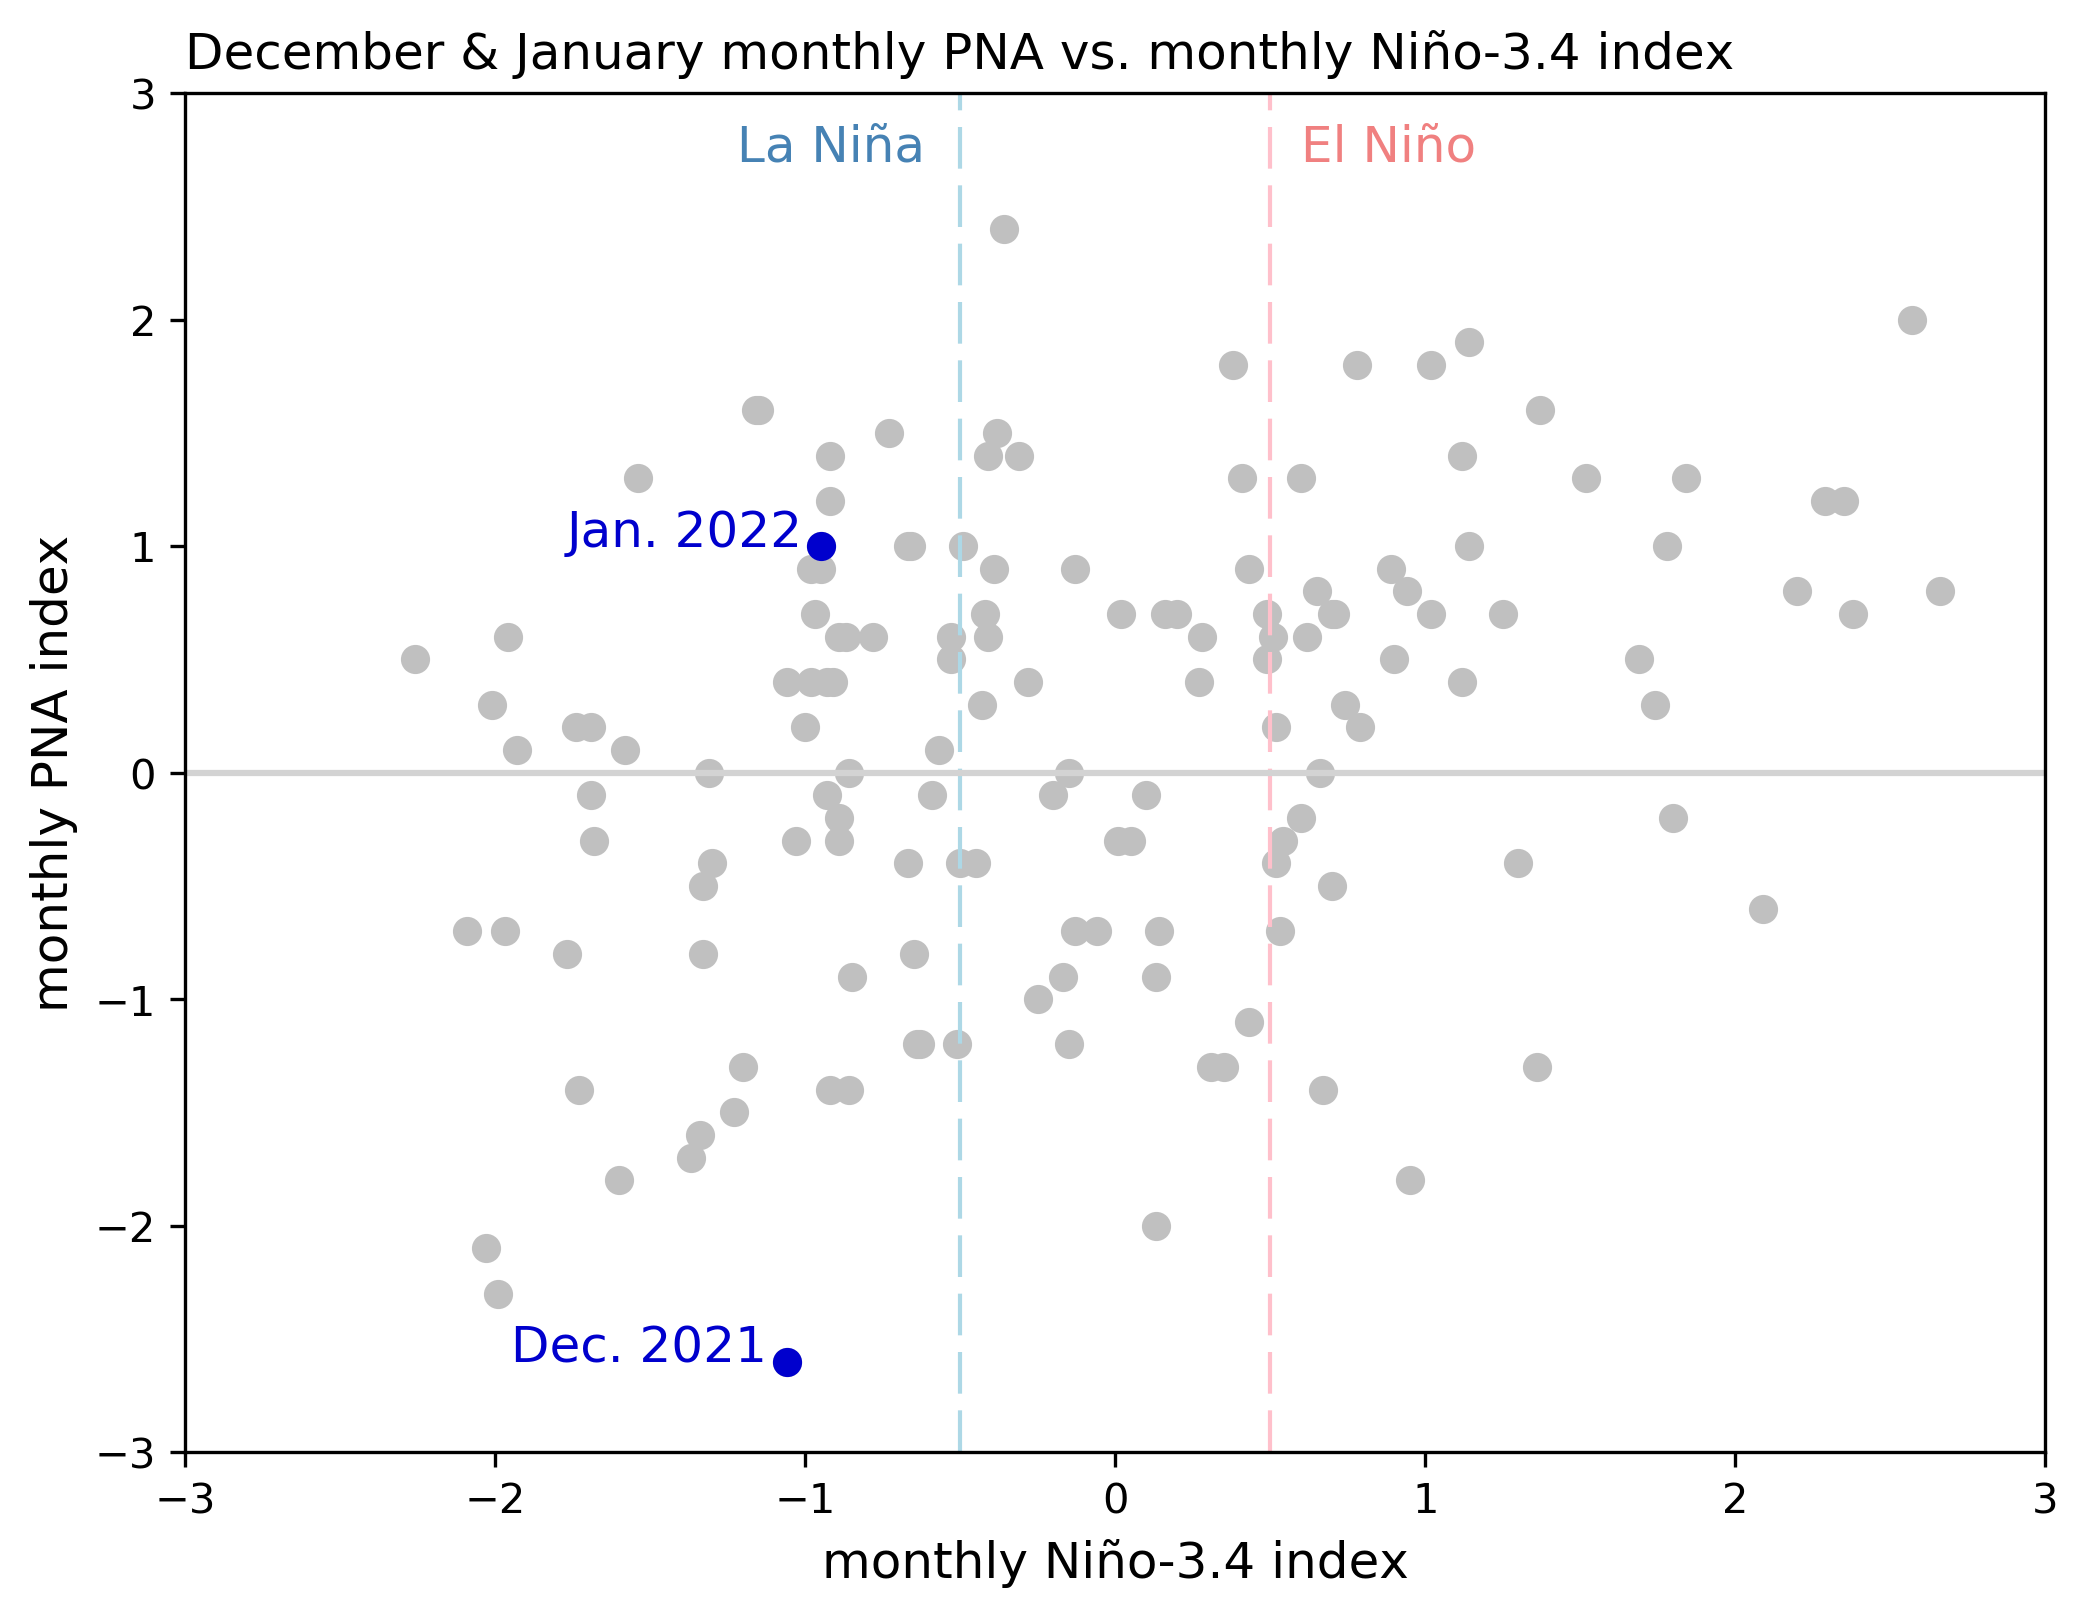
One-month-average Pacific-North America pattern index (vertical axis) versus the one-month-average Niño-3.4 index (horizontal axis) during Decembers and Januarys, 1950–2022. Climate.gov graph from CPC data.
One-month-average Pacific-North America pattern index (vertical axis) versus the one-month-average Niño-3.4 index (horizontal axis) during Decembers and Januarys, 1950–2022. Climate.gov graph from CPC data.