
Image caption
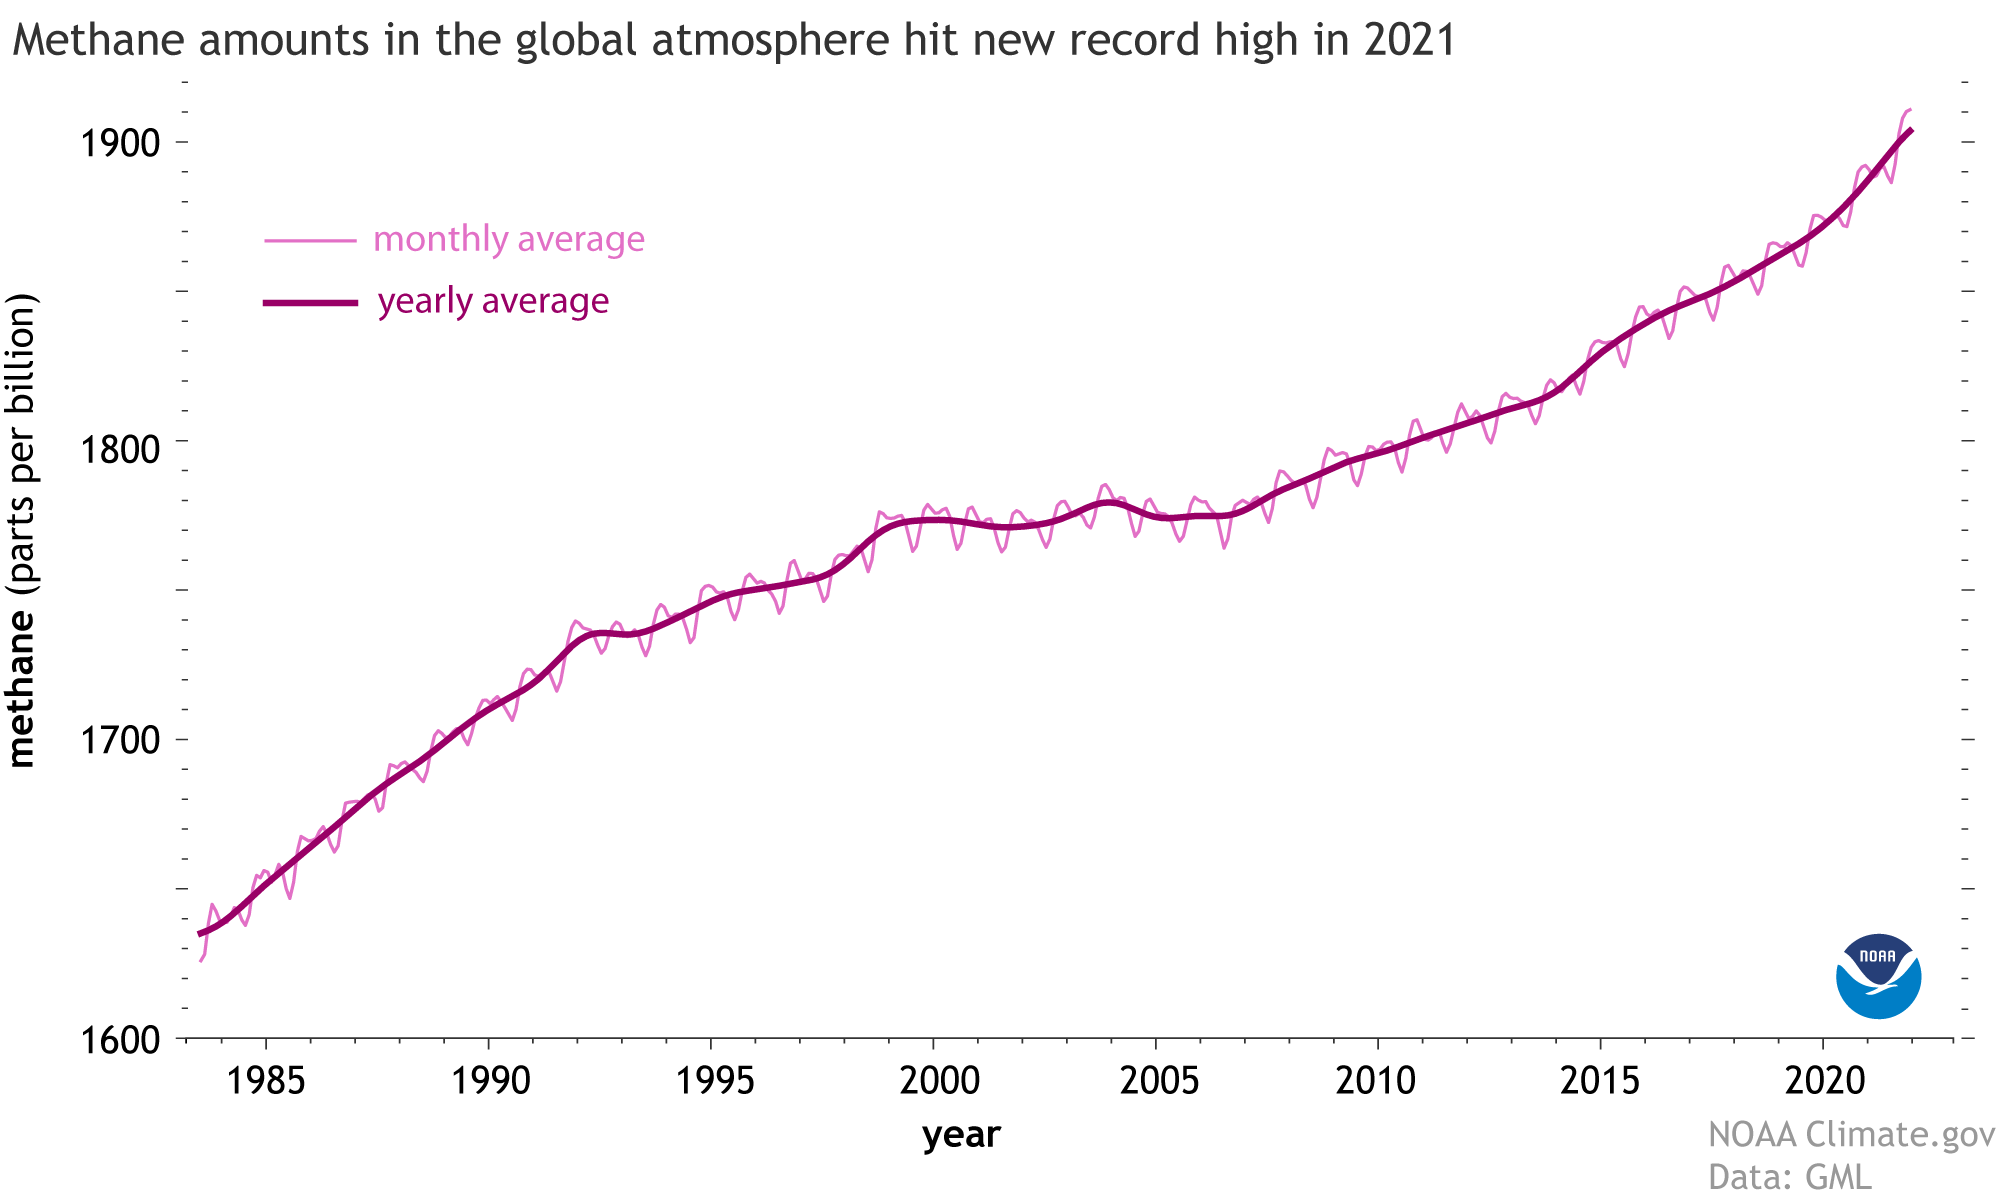
Globally averaged, monthly mean atmospheric methane amounts in parts per billion, based on observations from ocean surface sites since 1983. Values for the last year are preliminary. Image by NOAA Climate.gov, based on data from NOAA Global Monitoring Laboratory.