
Image caption
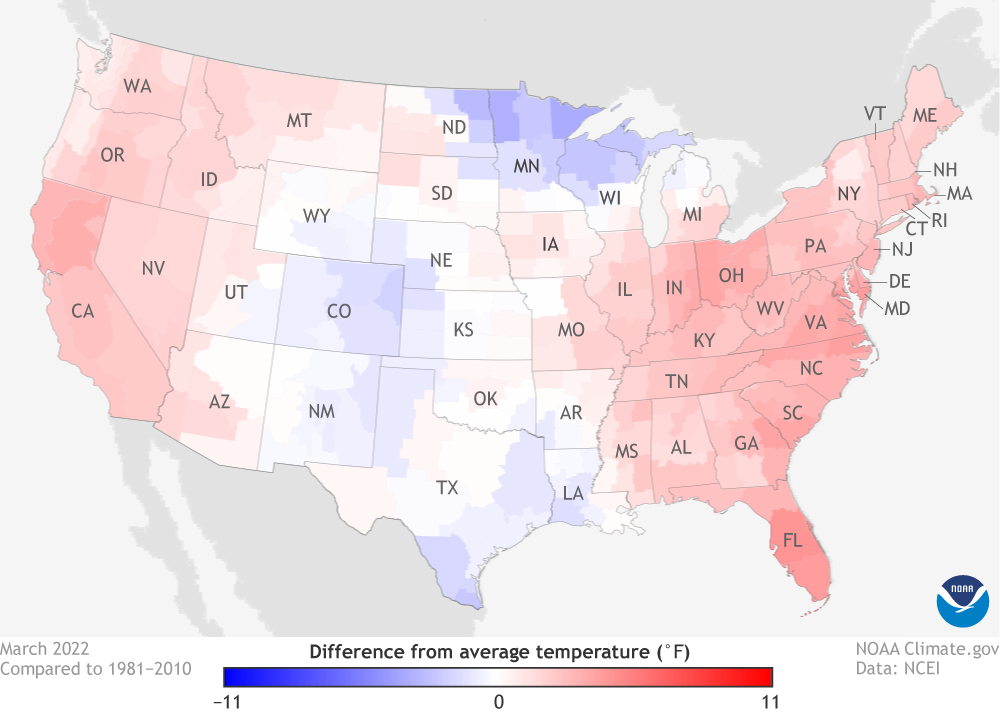
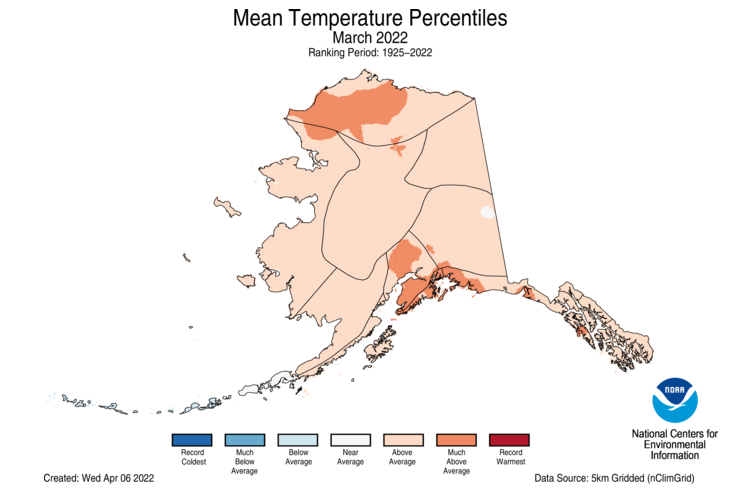
Average temperature in the contiguous United States in March 2022 compared to the 1981-2010 average. (View Alaska). Climate divisions that were warmer than average are in shades of red; divisions that were cooler than average are in shades of blue. NOAA Climate.gov map from our Data Snapshots collection, based on data from NOAA National Centers for Environmental Information.