
Image caption
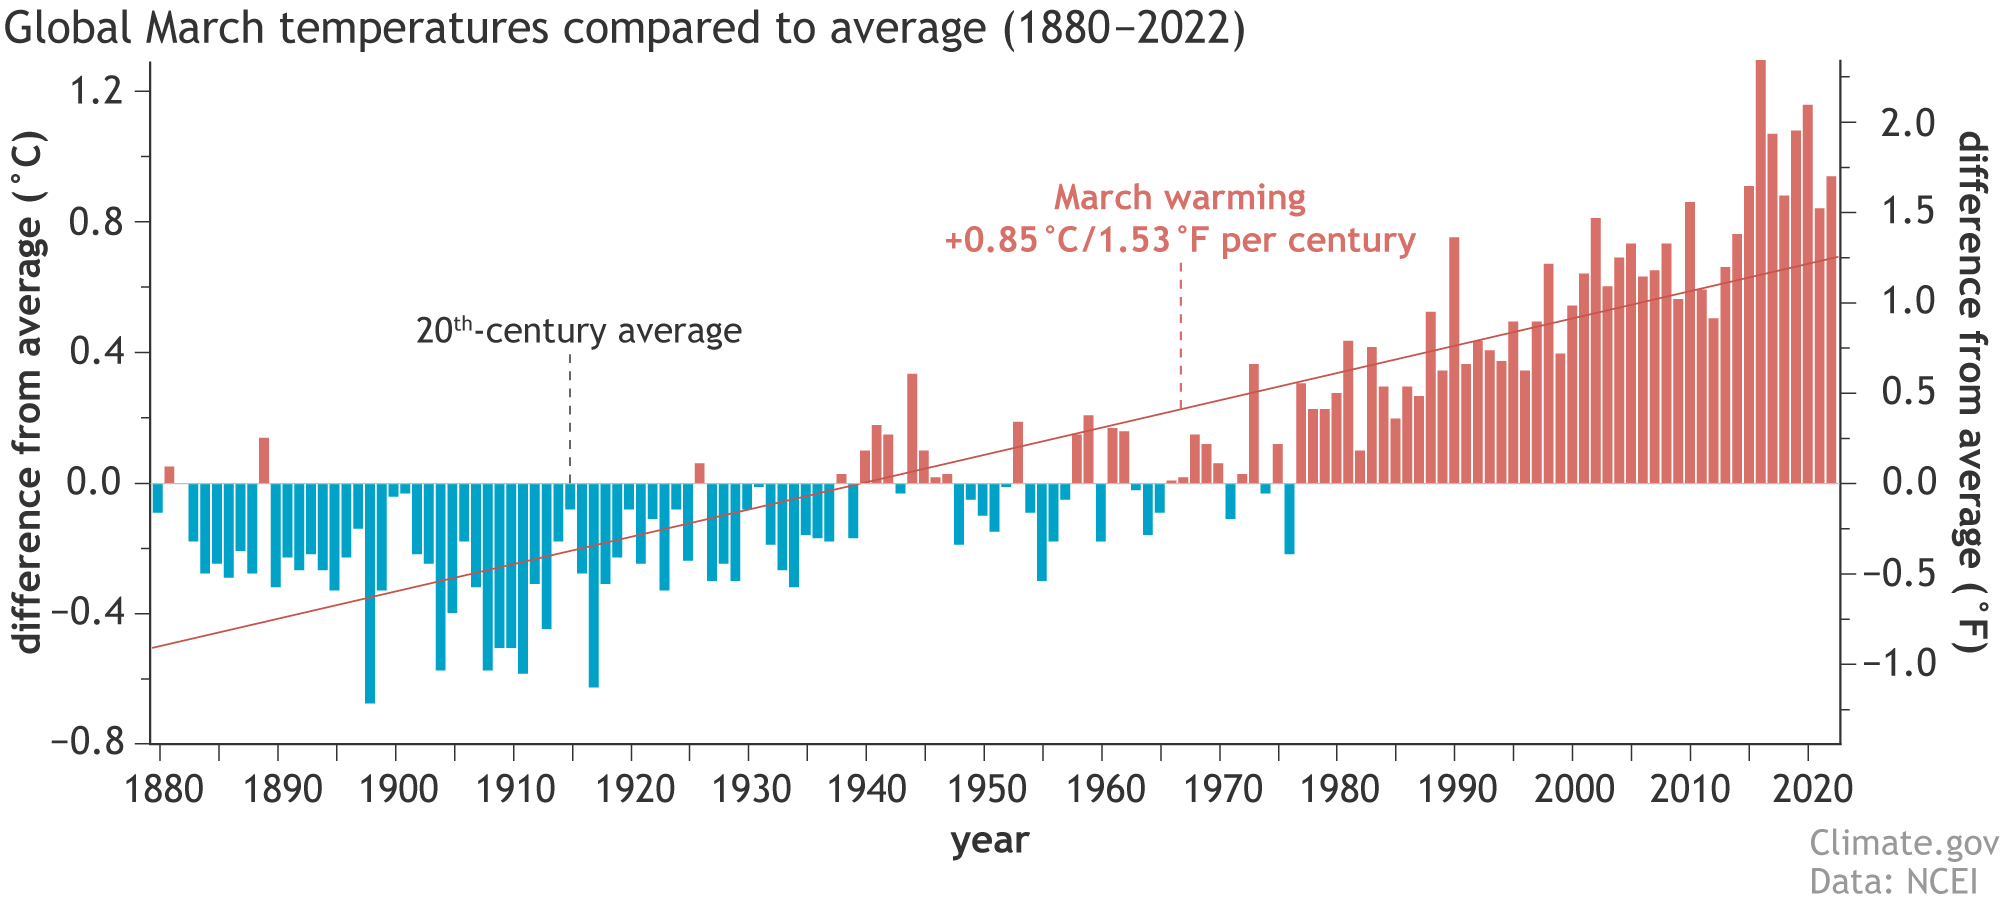
Global surface temperature compared to the 20th-century average each March from 1880 through 2022. Cooler-than-average Marches are colored blue; warmer-than-average Marches are red. March temperatures have warmed by 1.53 degrees Fahrenheit (0.85 degrees Celsius) per century. The last time Earth had a cooler-than-average March was 1976. Graph by NOAA Climate.gov, based on data from NOAA NCEI Climate at a Glance.