
Image caption
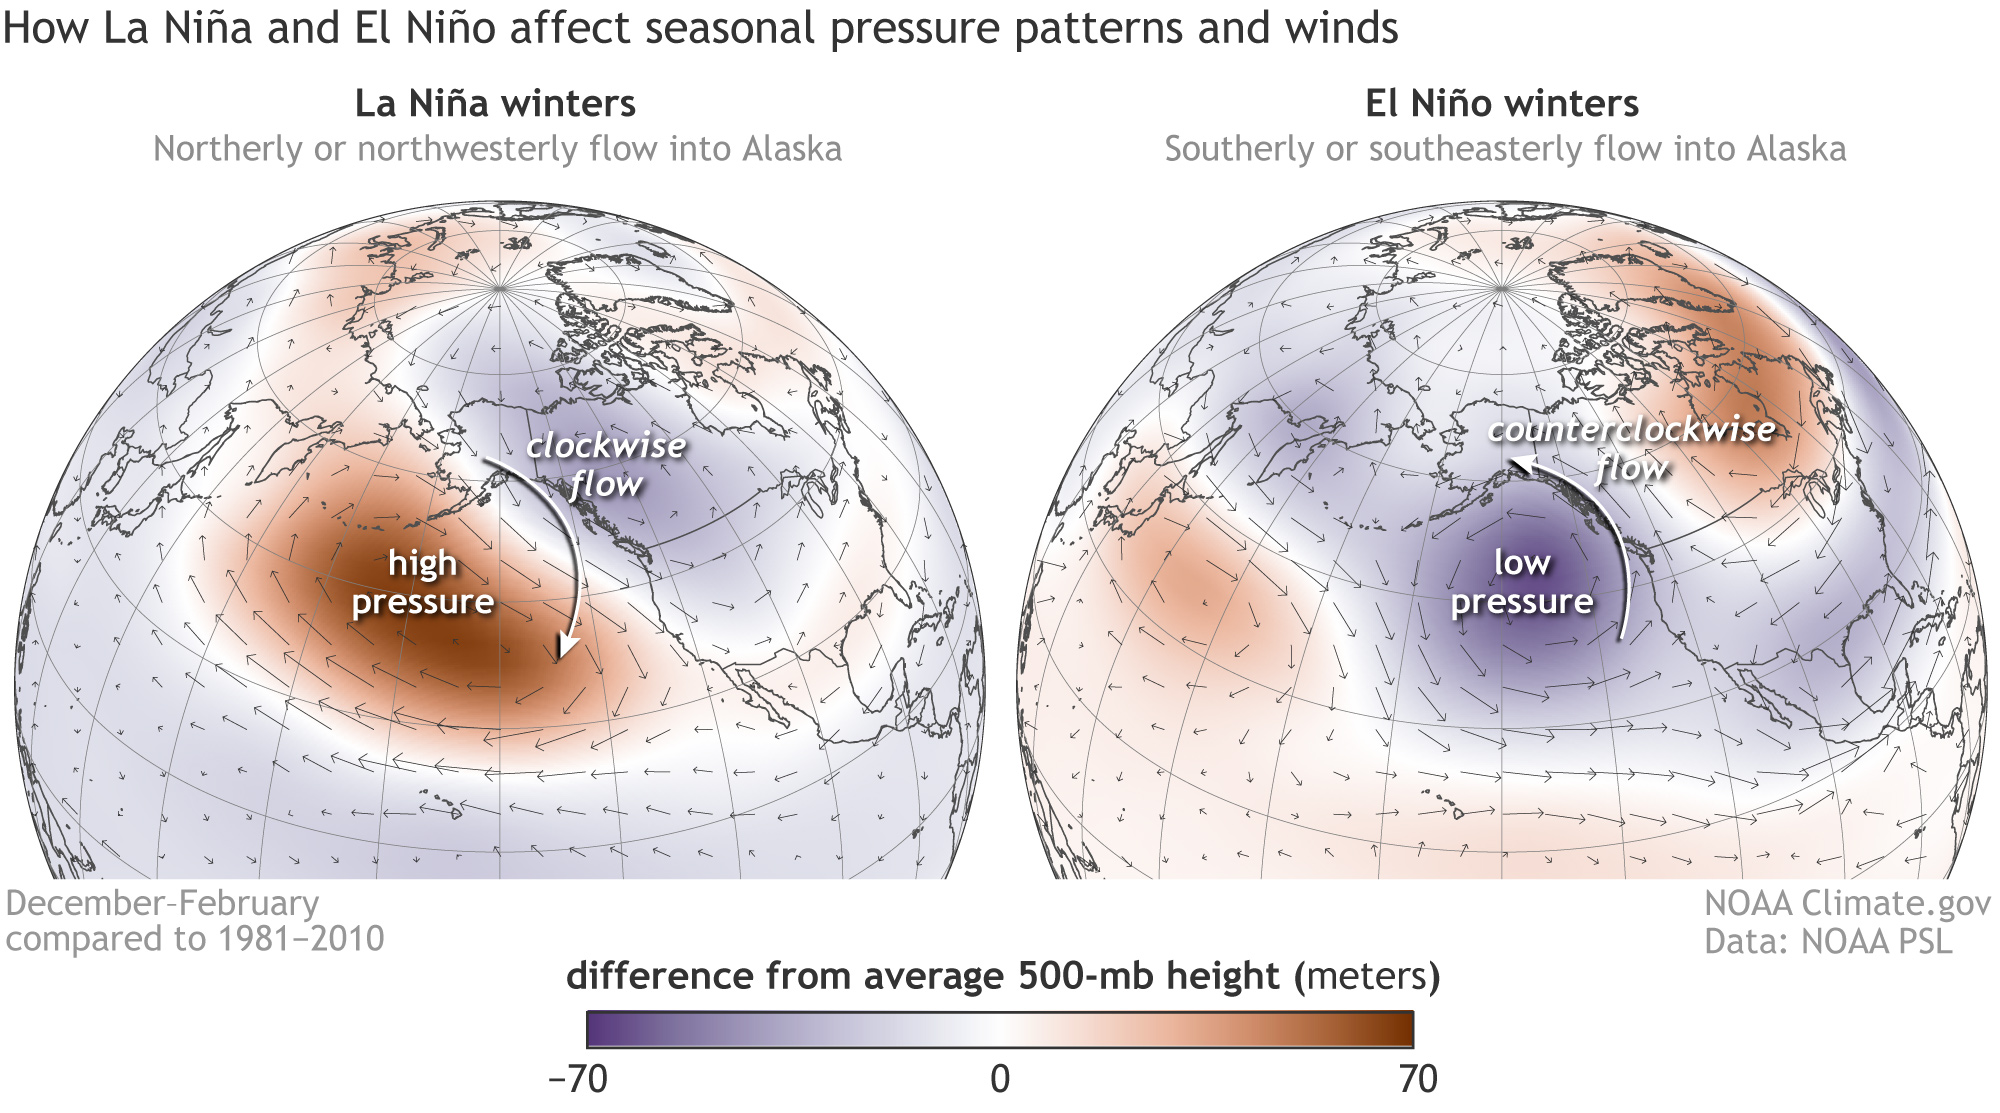
Difference from average air pressure and wind direction for all winters (December–February) with a moderate or strong La Niña (left) or El Niño (right). Moderate and strong are defined by anomalies of at least 1 degree Celsius in the Niño 3.4 region (NOAA's Oceanic Niño Index). The 500-millibar geopotential height is the height above Earth's surface where the air has thinned enough that the pressure has decreased to 500 millibars. (At the surface, it's a little over 1,000 millibars on average). Higher than average heights (orange) mean higher pressure than average; lower heights (purple) mean lower pressure than average. NOAA Climate.gov images based on data provided by NOAA Physical Science Laboratory.